The New Reports Module gives you an interactive way to explore your business data in real time. Instead of relying solely on static report outputs, you can analyze trends, filter information, and drill into the details that matter most to your operation. This flexible reporting experience puts meaningful insights at your fingertips, helping you make confident, data-driven decisions whenever you need them.
Table of Contents
- Important Details
- Coming Soon
- Available Reports
- Using Reports
- Filters Overview
- Adding Filters
- Widgets Overview
- Drill Down in Widgets
- Tables Overview
- Exporting Reports
- Related Articles
Important Details
- All packages will receive the full library of Reports.
- Additional Report types provide expanded capabilities.
- Filters reset to default after navigating away.
Coming Soon
- Reports will be user specific.
- Selected filters on each Report will be saved after navigating away.
- Reports will be permission based so only those employees with permission can see certain Reports.
- Save Reports as favorites.
- Widgets on module dashboards will reflect the same information found in Reports.
Available Reports
The New Reports Module includes several categories that give you focused insight into different parts of your business. These categories - Customer Reports, Financial Reports, Pipeline Reports, and Production Reports - help you analyze activity, review performance, and understand trends across your workflow.
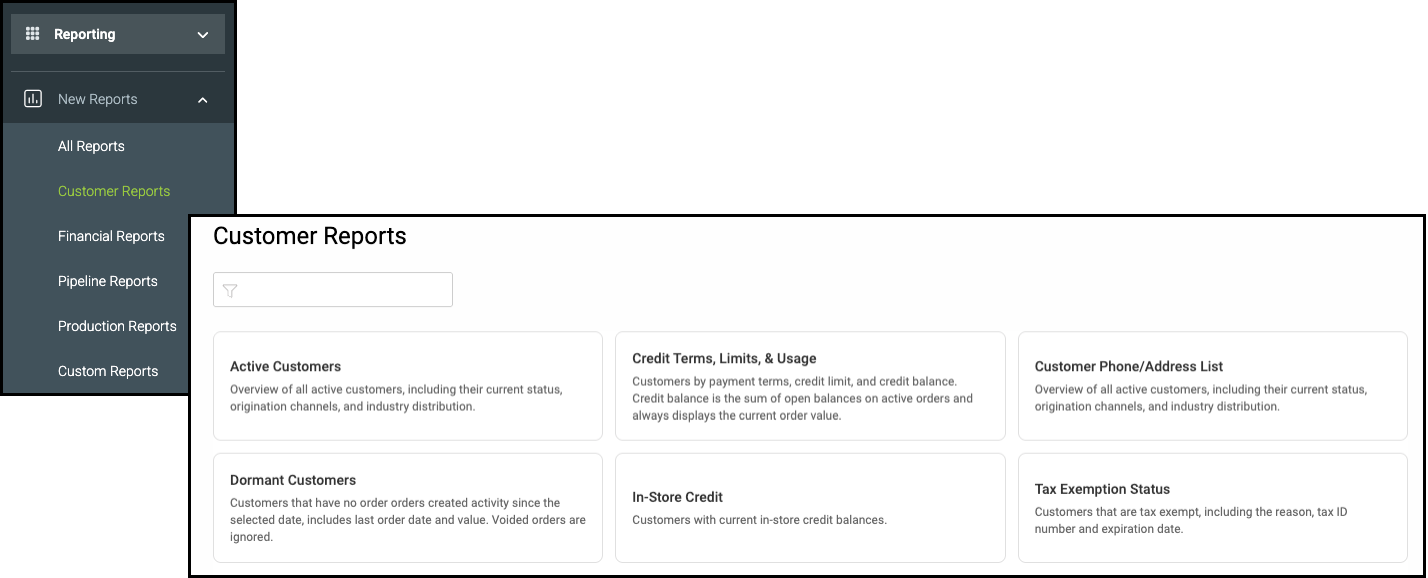
Customer Reports
a. Active Customers - Overview of all active customers, including their current status, origination channels, and industry distribution.
b. Credit Terms, Limits, & Usage - Customers by payment terms, credit limit, and credit balance. Credit balance is the sum of open balances on active orders and always displays the current order value.
c. Customer Phone/Address List - Overview of all active customers, including their current status, origination channels, and industry distribution.
d. Dormant Customers - Customers that have no order created activity since the selected date, includes last order date and value. Voided orders are ignored.
e. In-Store Credit - Customers with current in-store credit balances.
f. Tax Exemption Status - Customers that are tax exempt, including the reason, tax ID number and expiration date.
Financial Reports
a. Accounts Receivable Detail by Company - Accounts Receivable currently open and grouped by customer and aging period.
b. Accounts Receivable Details by Salesperson - Accounts Receivable currently open and grouped by salesperson, customer and aging period.
c. Accounts Receivable Summary - Accounts Receivable currently open and grouped by customer.
d. Financial Summary - Visualizes both period changes and current balances for income, expenses, assets, and liabilities for a selected reconciliation, providing a clear snapshot of financial movement and standing.
e. General Ledger Summary - Provides a view of general ledger activity for a selected financial periods, displaying balances across key accounts such as receivables, deposits, income and expenses.
f. Historical Accounts Receivable - History of accounts receivable for a specified date and grouped by customer.
g. Payment Details - Provides a detailed overview of all payment activity for a selected period, including total payment amounts, payment types, and processing methods.
h. Reconciliation Summary - Provides a comprehensive overview of the financial activity for a selected rconciliation, including summarizes total income, payments, receivables, and profit or loss balances, helping to ensure that account records align accurately.
i. Revenue by Company Industry - Overall Income, Cost, and Profit for each Company Industry for a time period. This report is based on financial general ledger and displays both positive and negative historical transaction of accounts.
j. Revenue by Company Origination - Overall Income, Cost, and Profit for each Company Origination for a time period. This report is based on financial general ledger and displays both positive and negative historical transactions of accounts.
k. Revenue by Component Type - Overall Income, Cost, and Profit for each Component for a time period. This report is based on financial general ledger and displays both positive and negative historical transactions of accounts.
l. Revenue by Customer - Overall Income, Cost, and Profit for each Customer for a time period. This report is based on financial general ledger and displays both positive and negative historical transactions of accounts.
m. Revenue by Income Account - Overall Income, Cost, and Profit for each Income Account for a time period. This report is based on financial general ledger and displays both positive and negative historical transactions of accounts.
n. Revenue by Line Item Category - Overall Income, Cost, and Profit for each Line Item Category for a time period. This report is based on financial general ledger and displays both positive and negative historical transactions of accounts.
o. Revenue by Month - Overall Income, Cost, and Profit for each Month for a time period. This report is based on financial general ledger and displays both positive and negative historical transactions of accounts.
p. Revenue by Order Origination - Overall Income, Cost, and Profit for each Order Origination for a time period. This report is based on financial general ledger and displays both positive and negative historical transactions of accounts.
q. Revenue by Salesperson - Overall Income, Cost, and Profit for each Salesperson for a time period. This report is based on financial general ledger and displays both positive and negative historical transactions of accounts.
r. Revenue by Year - Overall Income, Cost, and Profit for each Year for a time period. This report is based on financial general ledger and displays both positive and negative historical transactions of accounts.
s. Tax Liability by Tax Group - Tax Amount owed for a specified period and grouped by tax group.
t. Tax Liability by Tax Group & Tax Item - Tax Amount owed for a specified period and grouped by tax group and tax item.
u. Tax Liability by Tax Item - Tax Amount owed for a specified period and grouped by tax item.
Pipeline Reports
a. Current Estimates - Estimates currently in progress (Pending and Awaiting Approval).
b. Estimate Conversions - Provides visibility into estimate activity and conersion performance, including total estimate value, converted value, conversion rate, estimate value, converted value, conversion rate, estimate aging, and liecycle distribution. Helps identify sales team effectiveness, evaluate estimate follow-through, and monitor where estimates are progressing, stalled, or being lost.
c. Estimates by Customer - Highlights total estimate value, profit, and margin while identifying top quoting customers and estimate distribution by company. It supports sales tracking, customer engagement analysis, and performance evaluation across locations or sales staff.
d. Estimates by Entered By - Highlights total estimate value, profit, and margin while identifying top generating entered by employees and estimate distribution by employee. It supports sales tracking, customer engagement analysis, and performance evaluation across locations or sales staff.
e. Estimates by Estimate Origination - Highlights total estimate value, profit, and margin while identifying top generating originations and estimate distribution by origination. It supports sales tracking, customer engagement analysis, and performance evaluation across locations or sales staff.
f. Estimates by Salesperson - Highlights total estimate value, profit, and margin while identifying top quoting salespeople and estimate distribution by salesperson. It supports sales tracking, customer engagement analysis, and performance evaluation across locations or sales staff.
g. Estimate Win Loss by Customer - Performance of estimate conversion vs lost ratios during a specified period and grouped by customer. This report is based on workflow milestones and always displays the current estimate value.
h. Estimate Win Loss by Estimate Origination - Performance of estimate conversion vs lost ratios during a specified period and grouped by estimate origination. This report is based on workflow milestones and always displays the current estimate value.
i. Estimate Win Loss by Salesperson - Performance of estimate conversion vs lost ratios during a specified period and grouped by salesperson. This report is based on workflow milestones and always displays the current estimate value.
j. Order Performance by Customer - Performance of the order pipeline during a specified period and grouped by customer. This report is based on financial general ledger and displays both positive and negative historical transaction of accounts.
k. Order Performance by Order Origination - Performance of the order pipeline during a specified period and grouped by order origination. This report is based on financial general ledger and displays both positive and negative historical transaction of accounts.
l. Order Performance by Salesperson - Performance of the order pipeline during a specified period and grouped by salesperson. This report is based on financial general ledger and displays both positive and negative historical transaction of accounts.
m. Orders Voided - Displays all orders that have been voided within the system, including order details, void reasons, and financial values. This view allows users to review cancellations by date, salesperson, or location to ensure proper handling, identify recurring causes, and maintain accuracy in order management records.
Production Reports
a. Customer Balances - Displays all active customer orders in production along with payment progress and remaining balances. This view highlights total order value, amounts paid, and balances still due, helping teams track where revenue remains outstanding across production stages such as Pre-WIP, WIP, and Invoicing.
b. Estimated & Actual Cost Analysis - Compares the order estimated and actual costs to its Pre-Tax Total, including a margin comparison. This report always displays the current order value. This is not a historical financial tracking report.
c. Estimated vs Actuals - Overview of order components grouped by order number, key line item details, and component type with additional columns to report on actual quantity and costs.
d. Material Purchases Needed - Monitor materials required for production based on order due date, including each component, associated order, required quantities, and costs.
e. Quick Product Overview - Displays a comprehensive view of all Quick Products used in production, showing how they are categorized, who manages them, and which companies they belong to.
f. WIP by Line Item - Order Line Items currently in production (Pre-WIP, WIP, Built, Invoicing).
Using Reports
New Reports gives you the flexibility to work with your company data in real time. Key analytics and totals now appear at the top of the screen in dedicated widgets, with the most important information displayed in the top-left area and additional analysis available on the top-right. Use these widgets to sort, filter, compare, and drill into your data so you can find answers quickly without generating multiple reports.
Example: If a report includes a total, you’ll now see that number in the top-left widget instead of buried at the end of a report.
Navigate to Reporting and select the appropriate Report Category.
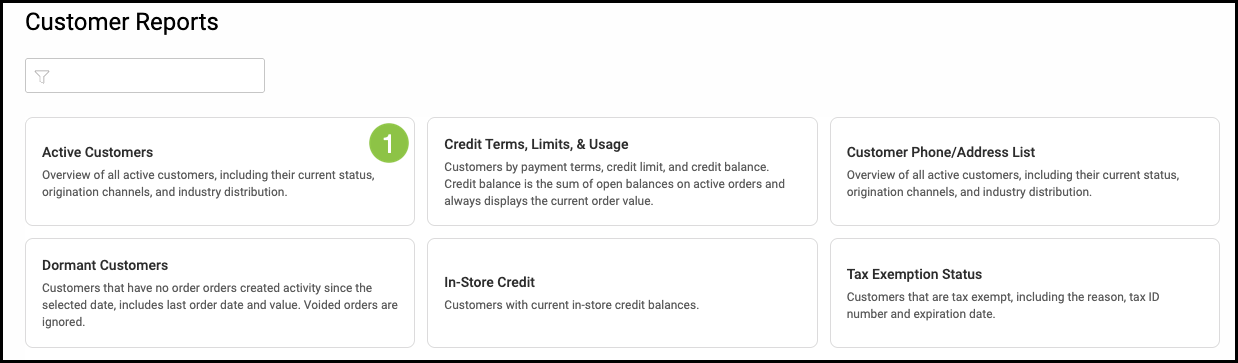
1. Select the appropriate Report.
Note: Reports all function in the same way. This article will use Active Customers as the example.

Filters Overview
a. Predefined Filters are located across the top of the Report. These are the most common filters for interacting with on a particular report.
b.This allows you to select whether the filter is set to Equals or Does not equal.
c. The dropdown for each filter allows you to select the desired option.
d. Filter Side Panel

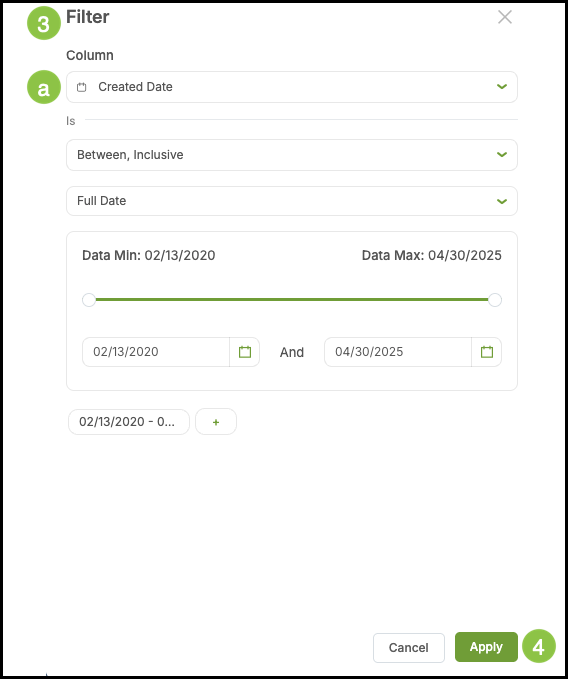
Adding Filters
1. Click the Plus button in the Filter Side Panel.
2. Select the Filter.
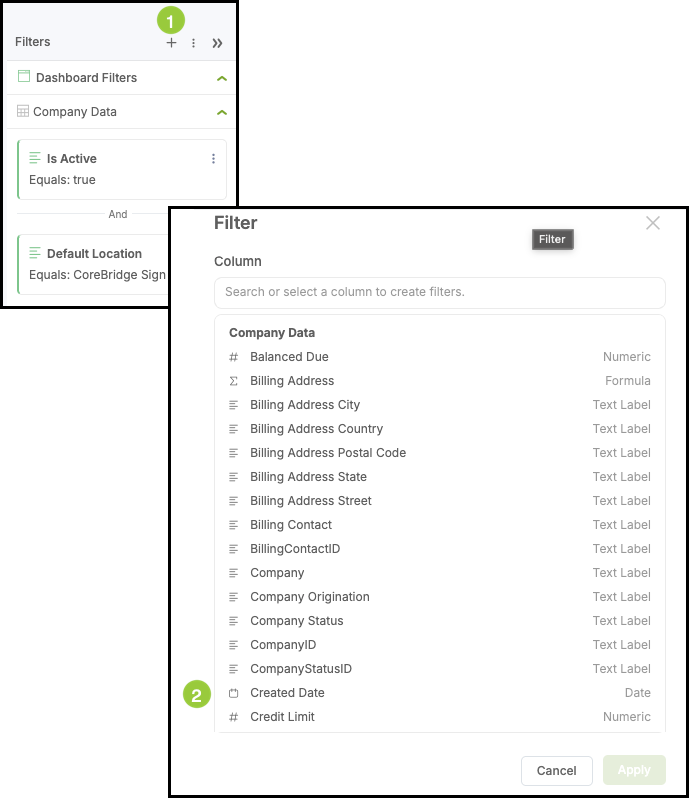
3. Fill in the appropriate details.
Note: Each Filter will have unique fields and dropdowns to fill out or select from.
a. This dropdown allows you to select a different Filter ,if desired.
4. Click Apply.
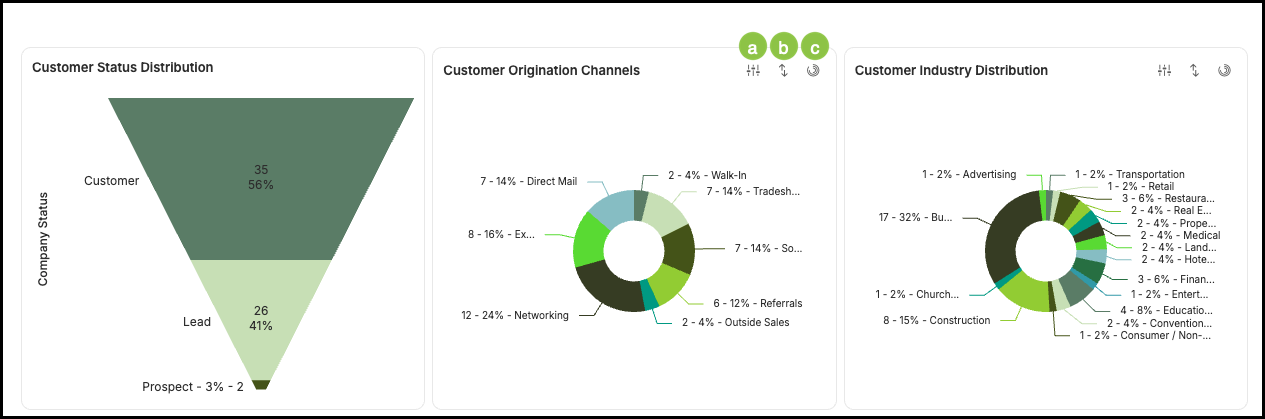
Widgets Overview
Widgets appear at the top of the report and provide real-time analytics. Each cell is its own widget, and tooltips display additional information as you hover over them.
Widgets are fully interactive - you can sort, filter, compare, and drill into the data they display. The most important analytics appear in the top-left section, while additional analysis appears on the top-right.
If a report includes totals, those values now appear in the top-left widgets instead of at the end of a traditional report.
Note: Some options shown may appear differently as each Widget is unique.
a. Column Settings - This allows you to select categories.
b. Sorting - This allows you to chose how you would like your categories sorted, either ascending or descending alphabetically.
c. Chart Selection - This allows you to change the style of chart displaying your information.
Note: Customization options are designed to work within each widget’s layout. For example, if a widget is built as a single chart, its customization tools will support that format rather than converting it into a double chart.
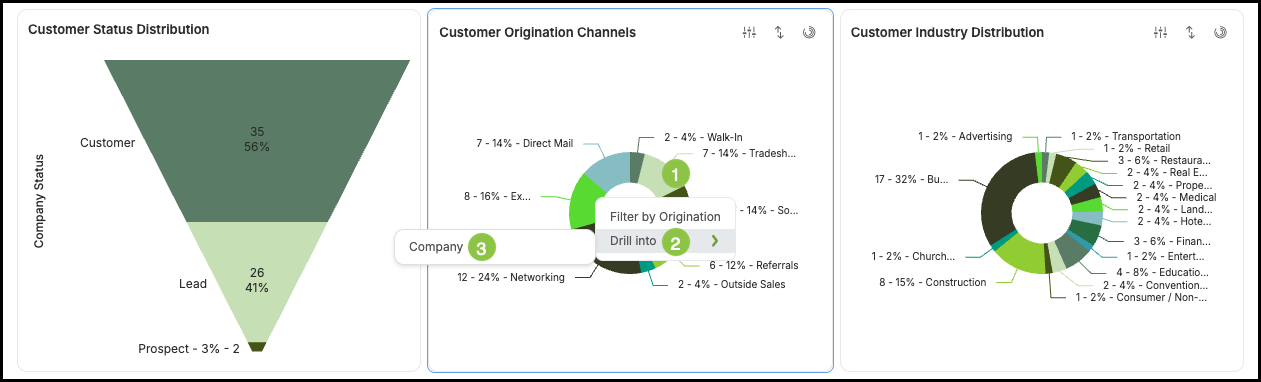
Drill Down in Widgets
1. Click on the chart.
2. Select Drill into.
3. Select the option.
Note: The Widget will then update with the detailed information.
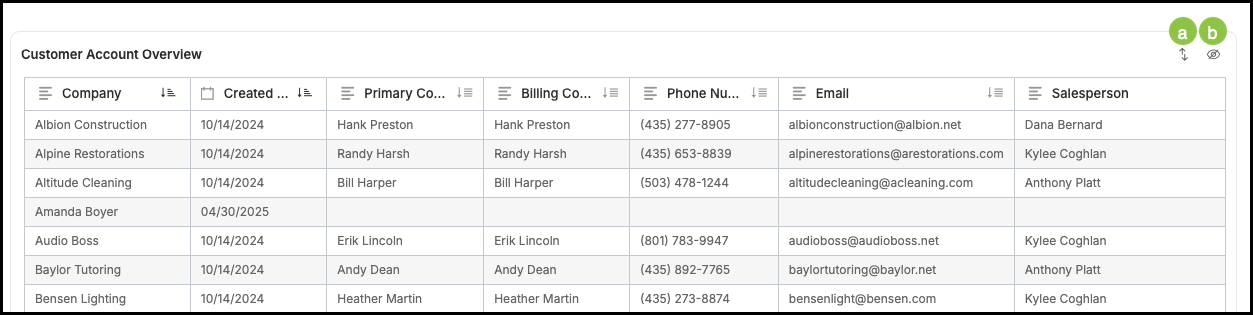
Tables Overview
Tables provide detailed, row-level information that supports the data shown in the Widgets. While they are less flexible than Widgets, they still include sorting options and the ability to add additional columns. Tables serve as the informational foundation of the report, giving you the data behind the analytics.
a. Sorting - This allows you to select how you would like the information in the table displayed.
b. Select Columns - This allows you to customize the Table by selecting the columns shown.
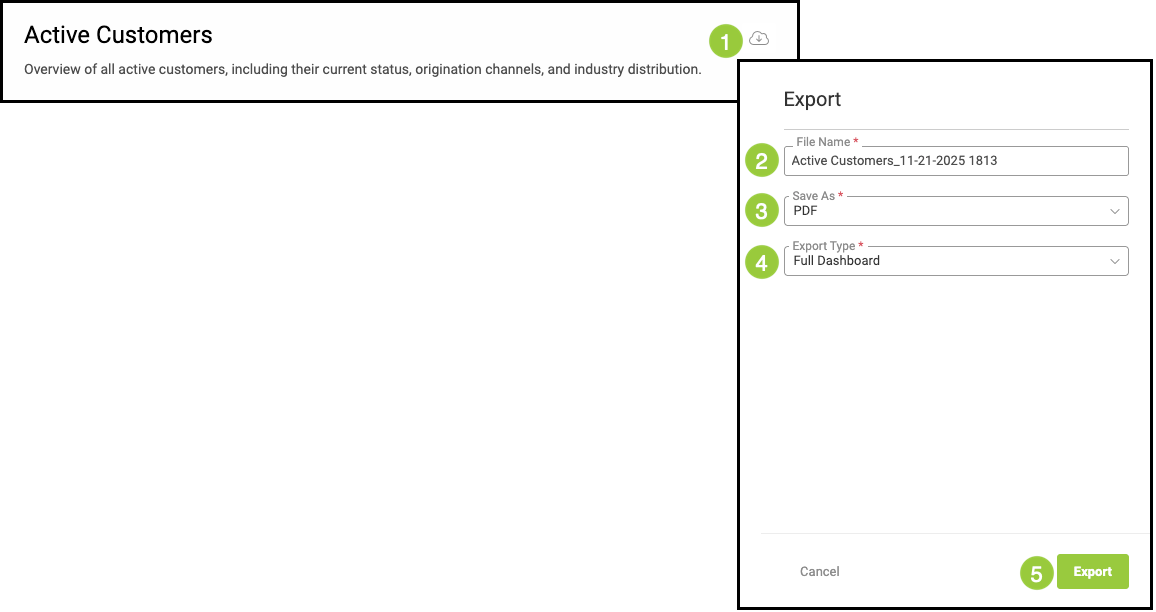
Exporting Reports
Exporting gives you a quick way to save or share the information you see on your screen. You can download a PDF version of the report, which captures the current view just like a screenshot. For the most complete set of data, simply open the full report before exporting to ensure all details are included in your export.
1. Click the Download icon.
2. Enter a File Name.
3. Select the file type.
Note: Export options include CSV-Summary, Excel, or PDF.
4. Select the Export Type.
Note: Options include Chart/Metric, or Full Dashboard.
5. Click Export.