The New Reports Module gives you an interactive way to explore your business data in real time. Instead of relying solely on static report outputs, you can analyze trends, filter information, and drill into the details that matter most to your operation. This flexible reporting experience puts meaningful insights at your fingertips, helping you make confident, data-driven decisions whenever you need them.
Important Information
- All packages will receive the full library of reports.
- All Reports are located in the Reporting Module for quick and easy access.
- Favorite Reports section is available once the first report has been marked as a favorite.
- Reporting Module sections are shown based on role-based permissions.
- For more information on what reports are available, please see Available Reports.
- For more information on converting old reports to new, please see Reports Conversion Guide.
Table of Contents
- Important Information
- Using Reports
- Refresh
- Favorite Reports
- Report Settings
- Preference Toolbar
- Filters
- Adding Filters
- Widgets Overview
- Drill Down in Widgets
- Tables Overview
- Exporting Reports
- Downloading Reports
- Related Articles
Using Reports
- New Reports gives you the flexibility to work with your company data in real time.
- Key analytics and totals now appear at the top of the screen in widgets, with the most important information displayed in the top-left area and additional analysis available on the top-right.
- Use these widgets to sort, filter, compare, and drill into your data so you can find answers quickly.
Example: If a report includes a total, you’ll now see that number in the top-left widget instead of buried at the end of a report.
Navigate to Reporting and select the appropriate Report Category.

1. Select the appropriate Report.
Note: Reports all function in the same way. This article will use Active Customers as the example.

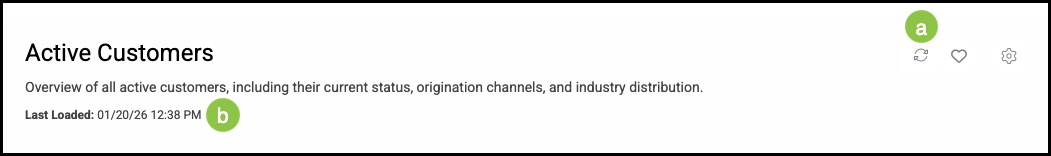
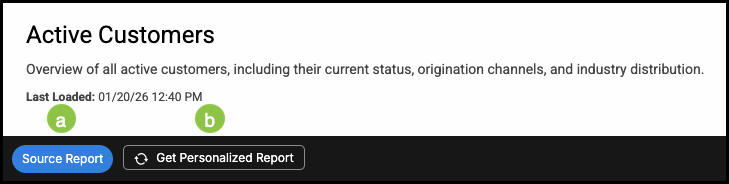
Refresh
- Reports display the most recent data available at the time they were last opened or refreshed.
a. Clicking the refresh button reloads the reports with the most recent data.
b. This shows the last time the report was loaded.
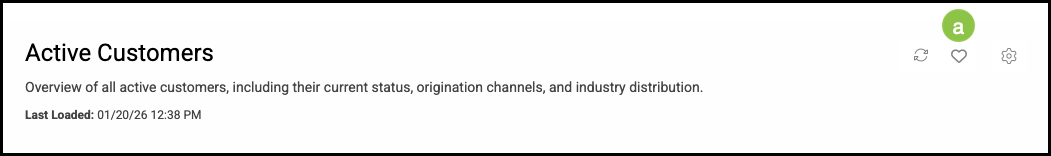
Favorite Reports
- The Favorite Reports section appears after at least one report has been marked as a favorite.
- Favorites are shared across the business, rather than being specific to an individual. Only reports you have permission to access will be displayed.
a. Clicking the heart will set this report as a favorite.
Note: Once the first report has been set as a favorite, you will see the Favorite Reports section in the module panel.
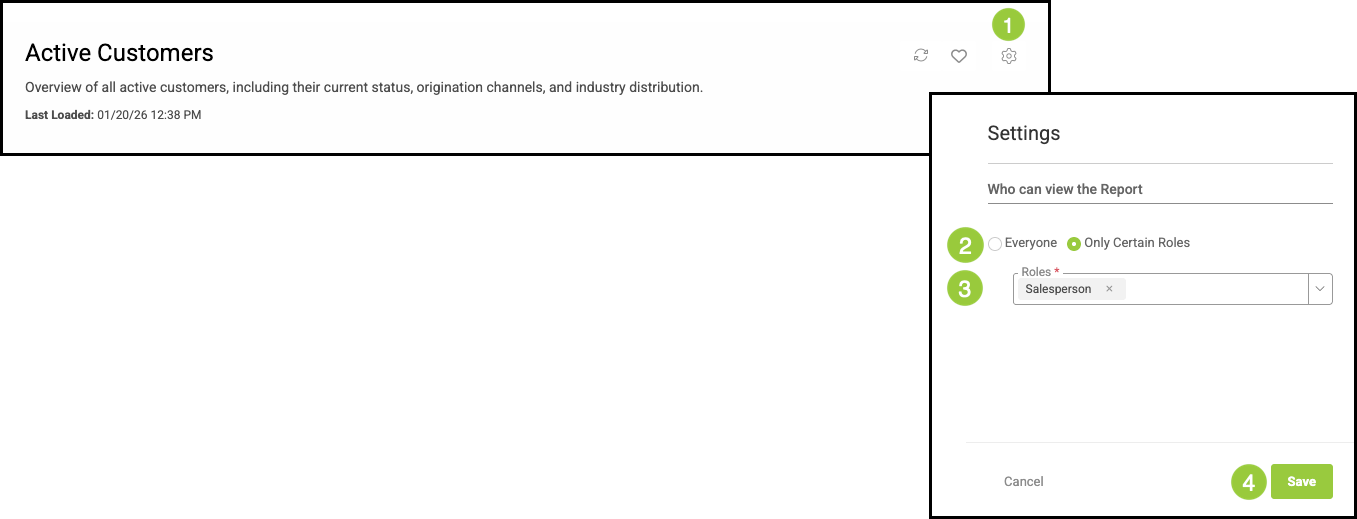
Report Settings
Viewing permissions are managed by Owners and Administrators through Report Settings.
1. Click the Settings icon.
2. Select either Everyone or Only Certain Roles.
Note: The default permission is set to Everyone.
3. Select Roles.
Note: This step is only visible when Only Certain Roles is selected.
4. Click Save.
Preference Toolbar
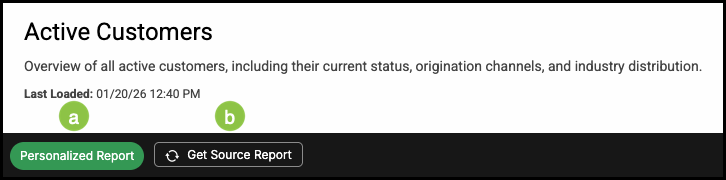
a. This button indicates the report version you are currently viewing.
b. This button will return you to the alternate version of the dashboard.
- Personalized Report indicates you have made selections to customize your widgets.
- Source Report is the default version of the report settings.
Note: These two buttons can be used to toggle between views.
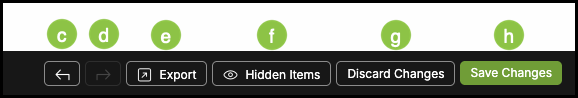
c. The back button takes you to the previous filter settings.
d. The forward button takes you to the filter selected after the one you are currently viewing.
e. The Export button opens a dropdown allowing you to select an export type.
Note: For more information on Exporting, please see below.
f. Clicking this will allow you to see Hidden Items.
g. Clicking Discard Changes will reverse any selections you have made.
h. Save Changes will save your save your filter selections for the next time you view this report.
Filters
Filters control which data appears in a report. For more information, please see Reporting Filters.
a. Predefined Filters are located across the top of the report. These are the most common filters for interacting with on a particular report.
b. This allows you to select whether the filter is set to Equals or Does not equal.
Note: This option is found on text selections.
c. The dropdown for each filter allows you to select the desired option.
d. This dropdown allows you to select an inclusion option for the date range.
Note: This option is found on date selections.
e. Filter Side Panel

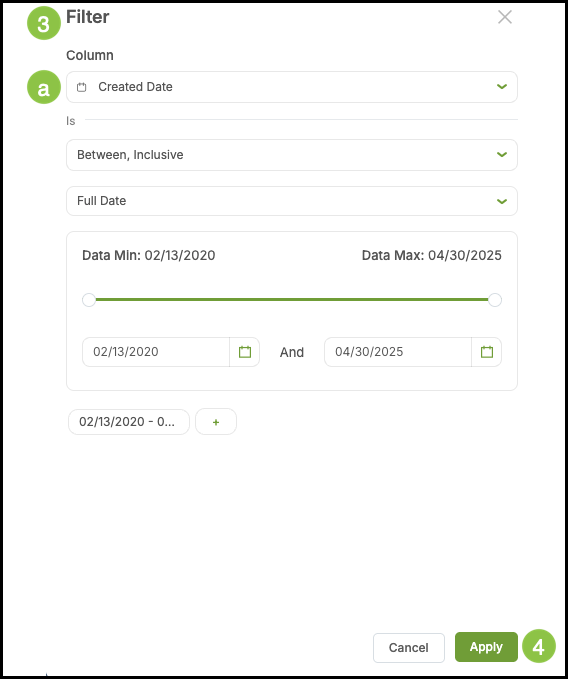
Adding Filters
1. Click the Plus button in the Filter Side Panel.
2. Select the Filter.
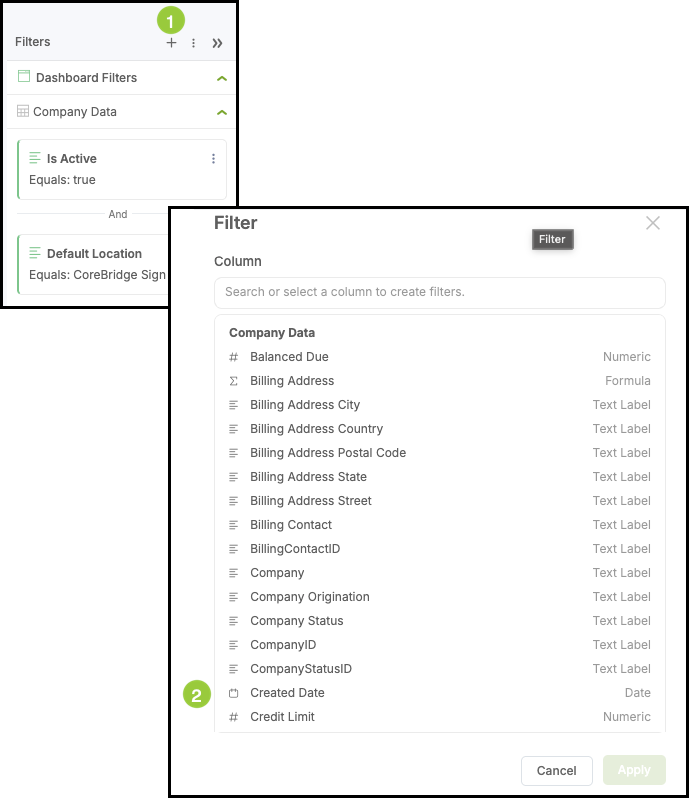
3. Fill in the appropriate details.
Note: Each Filter will have unique fields and dropdowns to fill out or select from.
a. This dropdown allows you to select a different Filter, if desired.
4. Click Apply.
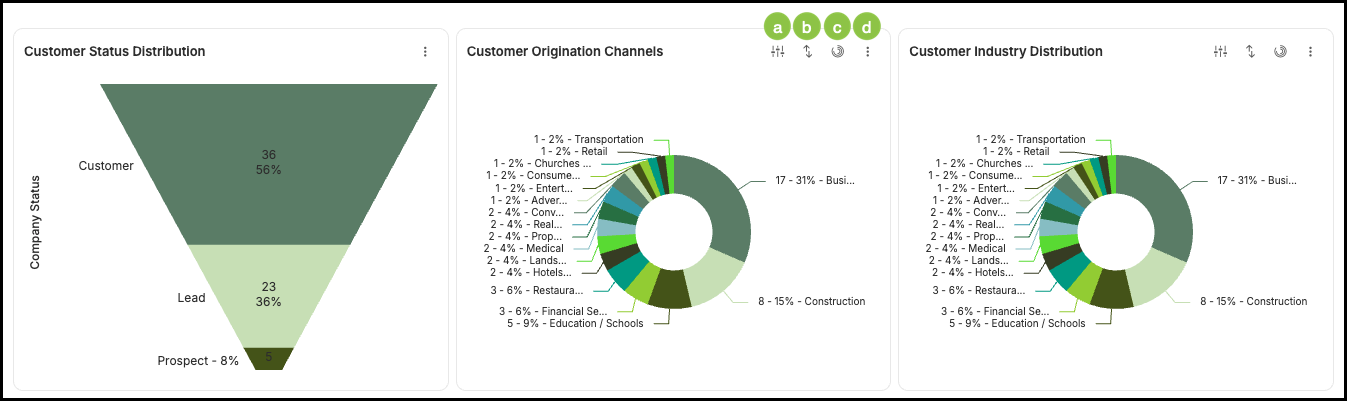
Widgets Overview
- Widgets appear at the top of the report and provide real-time analytics.
- Each cell is its own widget, and tooltips display additional information as you hover over them.
- Widgets are fully interactive - you can sort, filter, compare, and drill into the data they display. The most important analytics appear in the top-left section, while additional analysis appears on the top-right.
- If a report includes totals, those values now appear in the top-left widgets instead of at the end of a traditional report.
- Some options shown may appear differently as each Widget is unique.
a. Column Settings - This allows you to select categories.
b. Sorting - This allows you to chose how you would like your categories sorted, either ascending or descending alphabetically.
c. Chart Selection - This allows you to change the style of chart displaying your information.
Note: Customization options are designed to work within each widget’s layout. For example, if a widget is built as a single chart, its customization tools will support that format rather than converting it into a double chart.
d. The ellipsis opens up the option to download the widget. For more information on downloading, see below.
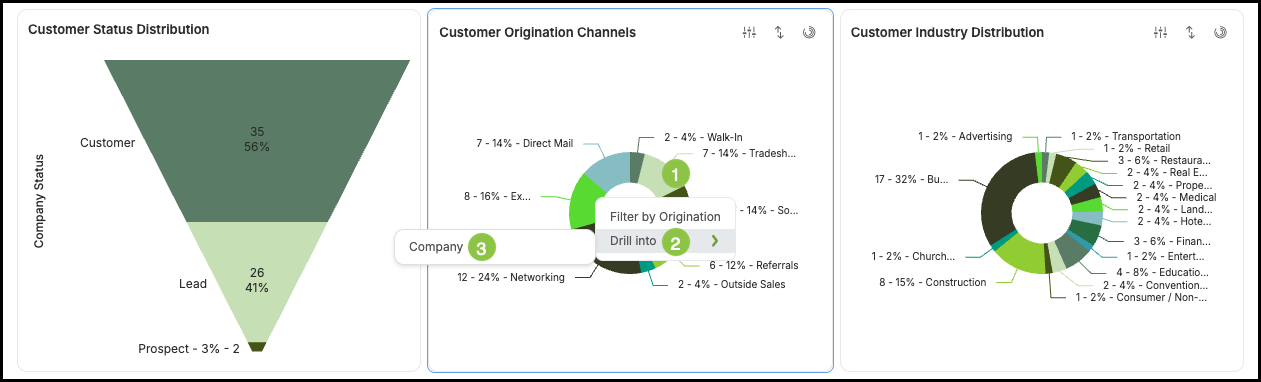
Drill Down in Widgets
For more information on how to Drill Down, please see Drill Down in Reporting.
1. Click on the chart.
2. Select Drill into.
3. Select the option.
Note: The Widget will then update with the detailed information.
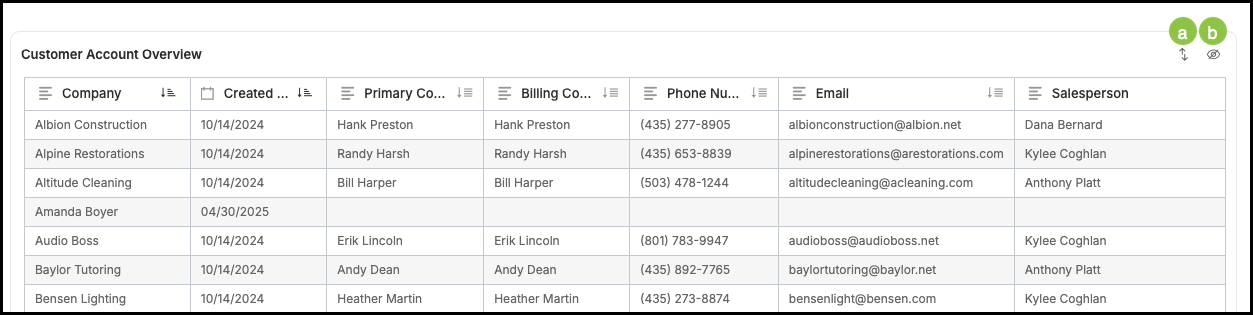
Tables Overview
- Tables provide detailed, row-level information that supports the data shown in the Widgets.
- Include sorting options and the ability to add additional columns.
- Tables serve as the informational foundation of the report, giving you the data behind the analytics.
a. Sorting - This allows you to select how you would like the information in the table displayed.
Note: For more information on Sorting, please see Sorting Options in Reporting.
b. Select Columns - This allows you to customize the table by selecting the columns shown.
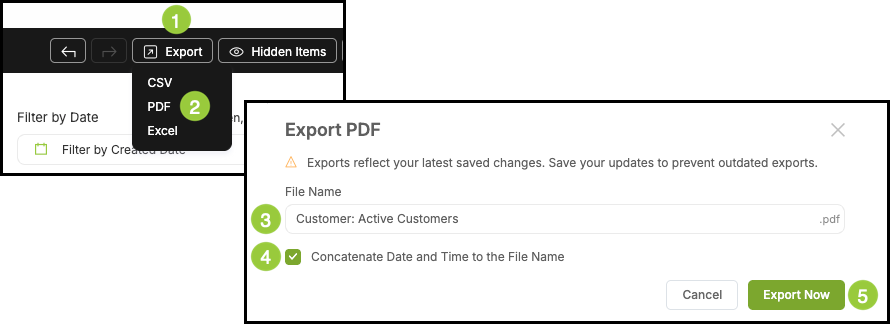
Exporting Reports
- Exporting gives you a quick way to save or share the information you see on your screen.
1. Click the Export button.
2. Select the export type.
Note: All export types have the same steps. This article uses PDF as the example.
3. Edit the File Name, if desired.
4. Select this option if you would like the system to automatically add the current date and time to the end of the time name.
5. Click Export Now.
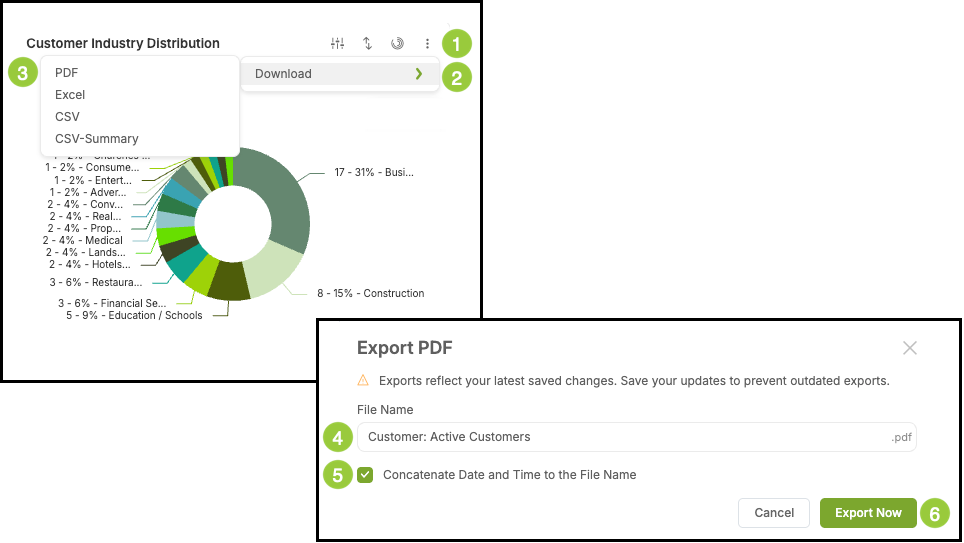
Downloading Reports
- Downloading Reports allows you to save and share detailed information in individual reports.
1. Select the ellipsis on the widget.
2. Hover over Download.
3. Select the download type.
Note: All download types have the same steps. This article uses PDF as the example.
4. Edit the File Name, if desired.
5. Select this option if you would like the system to automatically add the current date and time to the end of the time name.
6. Click Export Now.