Reports in CoreBridge help you access and understand the data that matters most to your business. This article walks through the reporting experience, from locating reports in the Report Library to reviewing and working with results in the Report Viewer. You’ll learn how to run reports, refine them using filters and date ranges, switch between table and chart views, and export or print your results. Whether you’re analyzing performance or sharing insights, this guide covers the typical flow of finding a report, adjusting its scope, and using the results effectively.
Data in reports is refreshed regularly to reflect recent activity across the system. Depending on system activity and processing times, there may be a short delay before the latest updates appear in reporting. If you’ve recently made changes and don’t see them reflected right away, try refreshing the page or check back shortly.
For more information on report availability, please see Available Reports
Table of Contents
Finding Reports
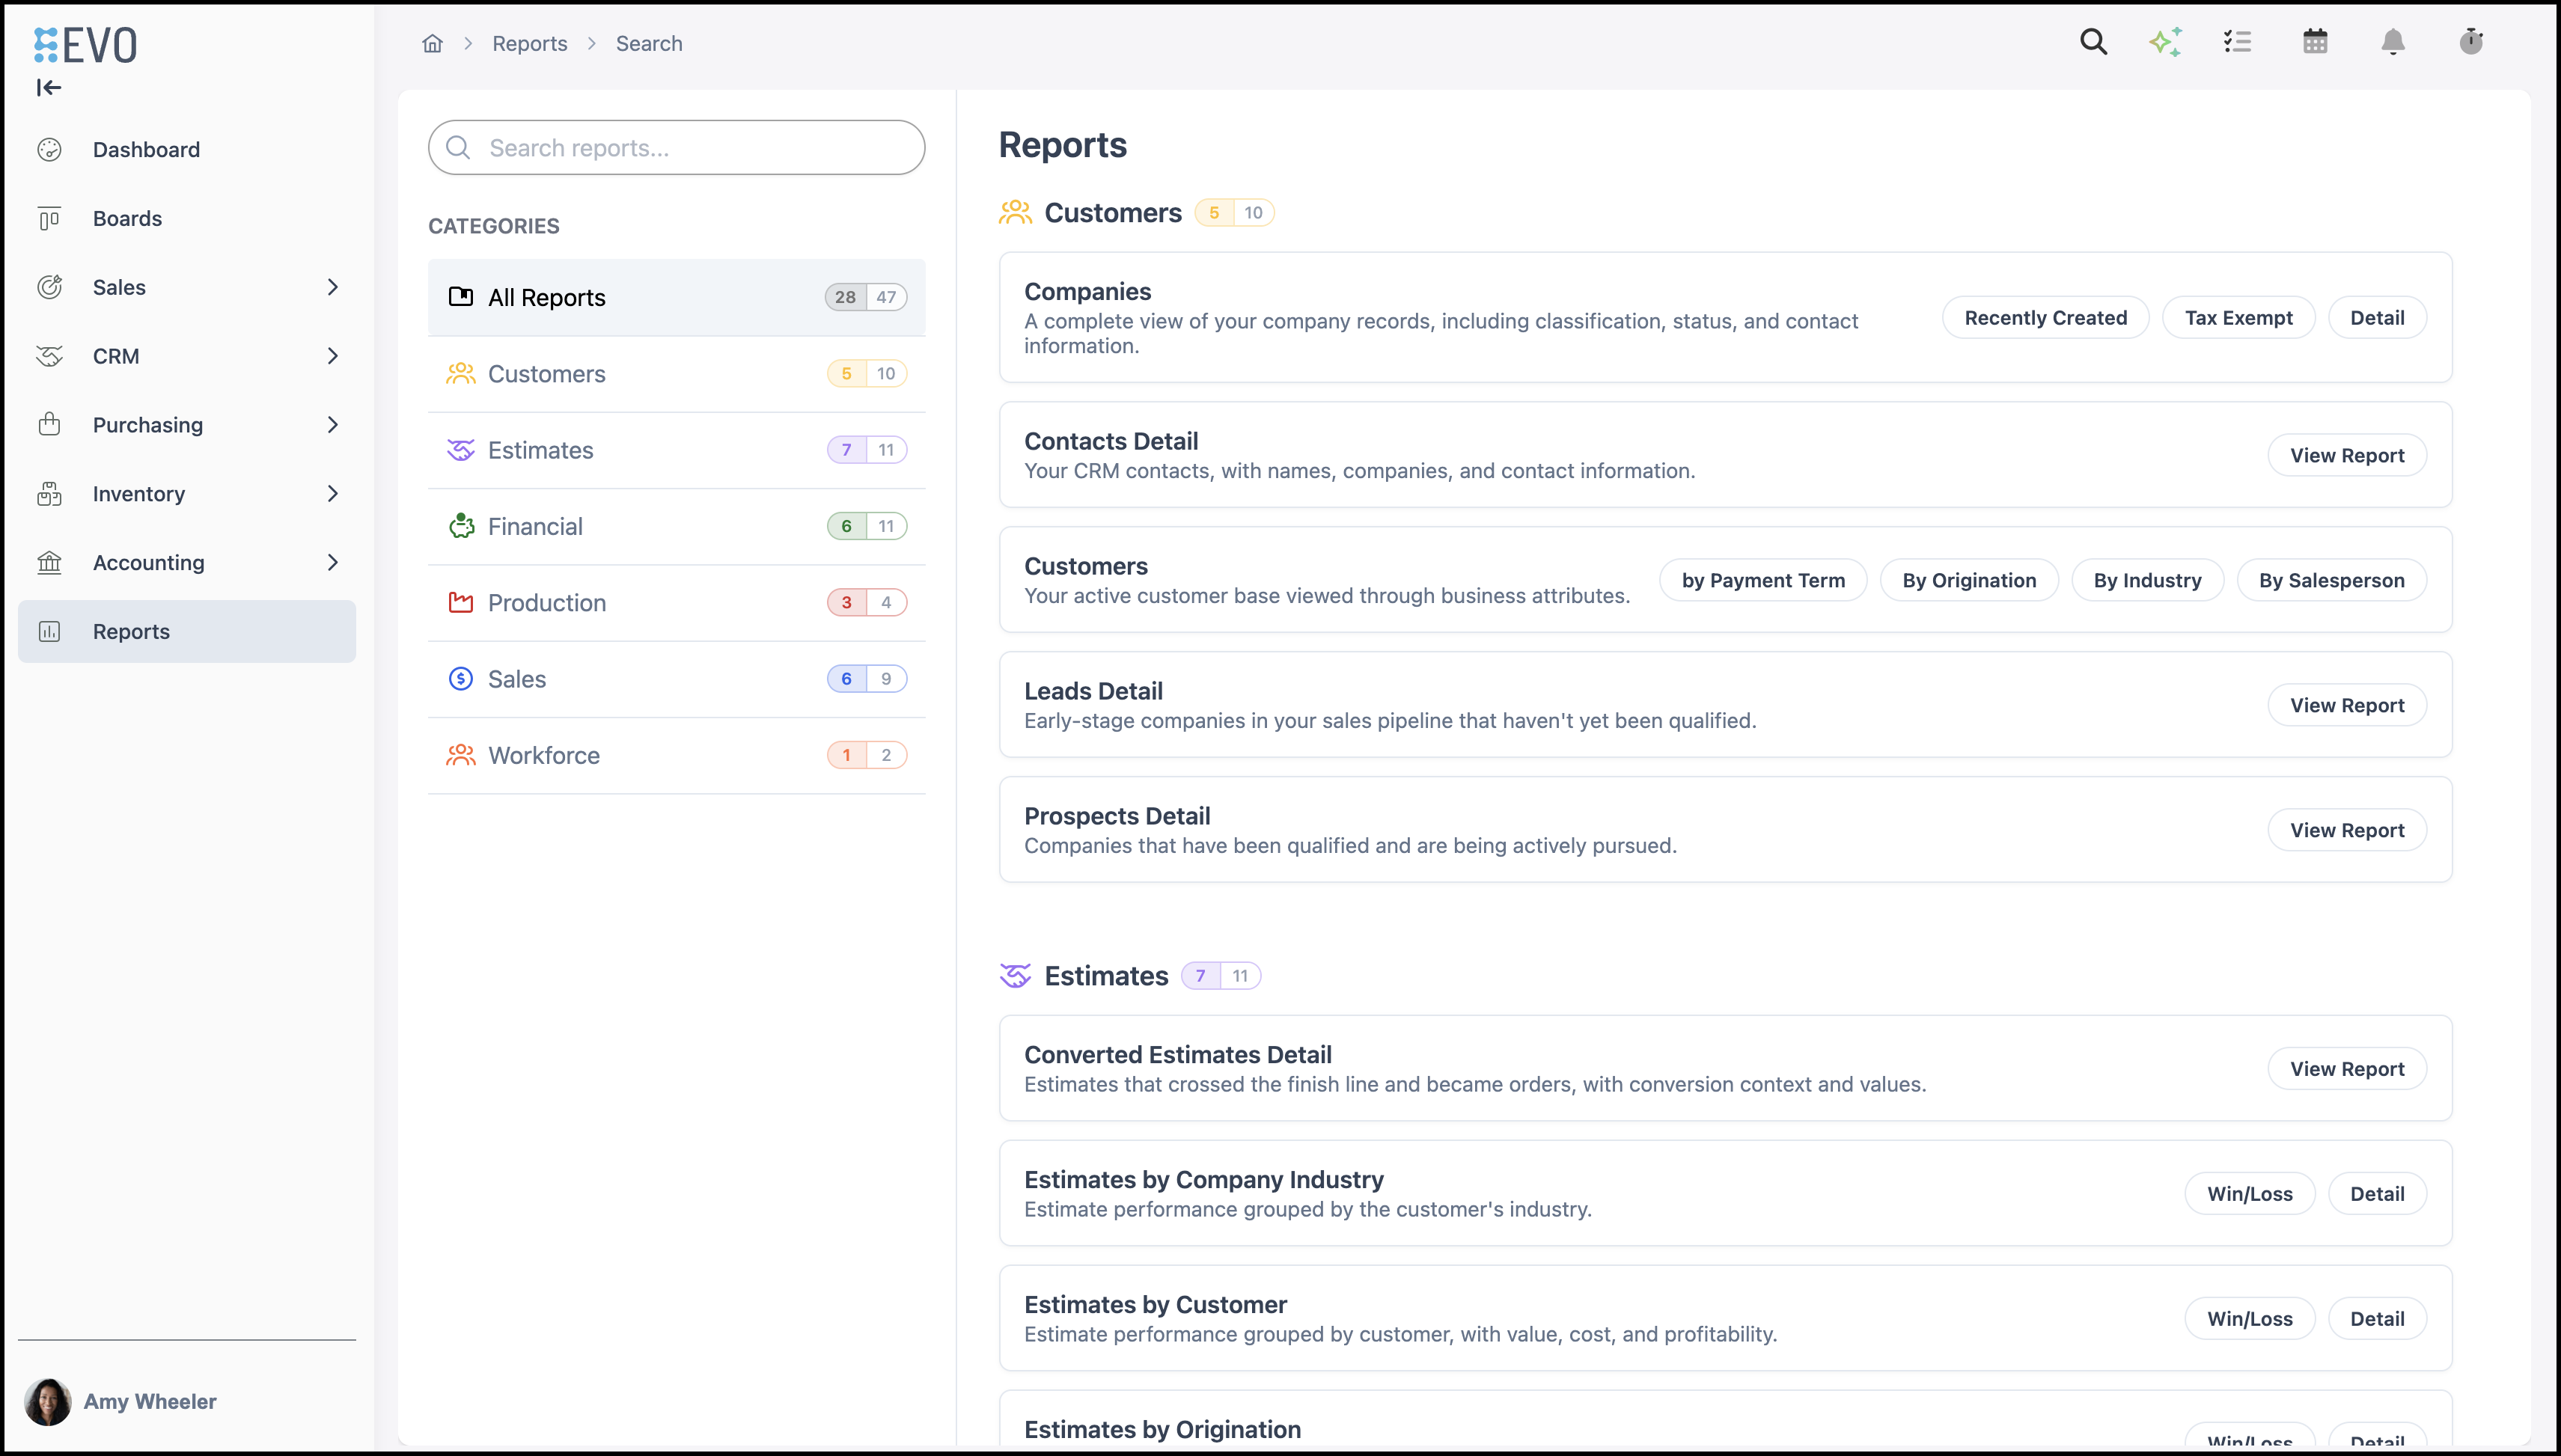
The Report Library is where people discover published reports. The Report Viewer is where they review results, refine them with filters and dates, switch between table and chart, export to CSV, and print.
Navigate to the Reports Module.
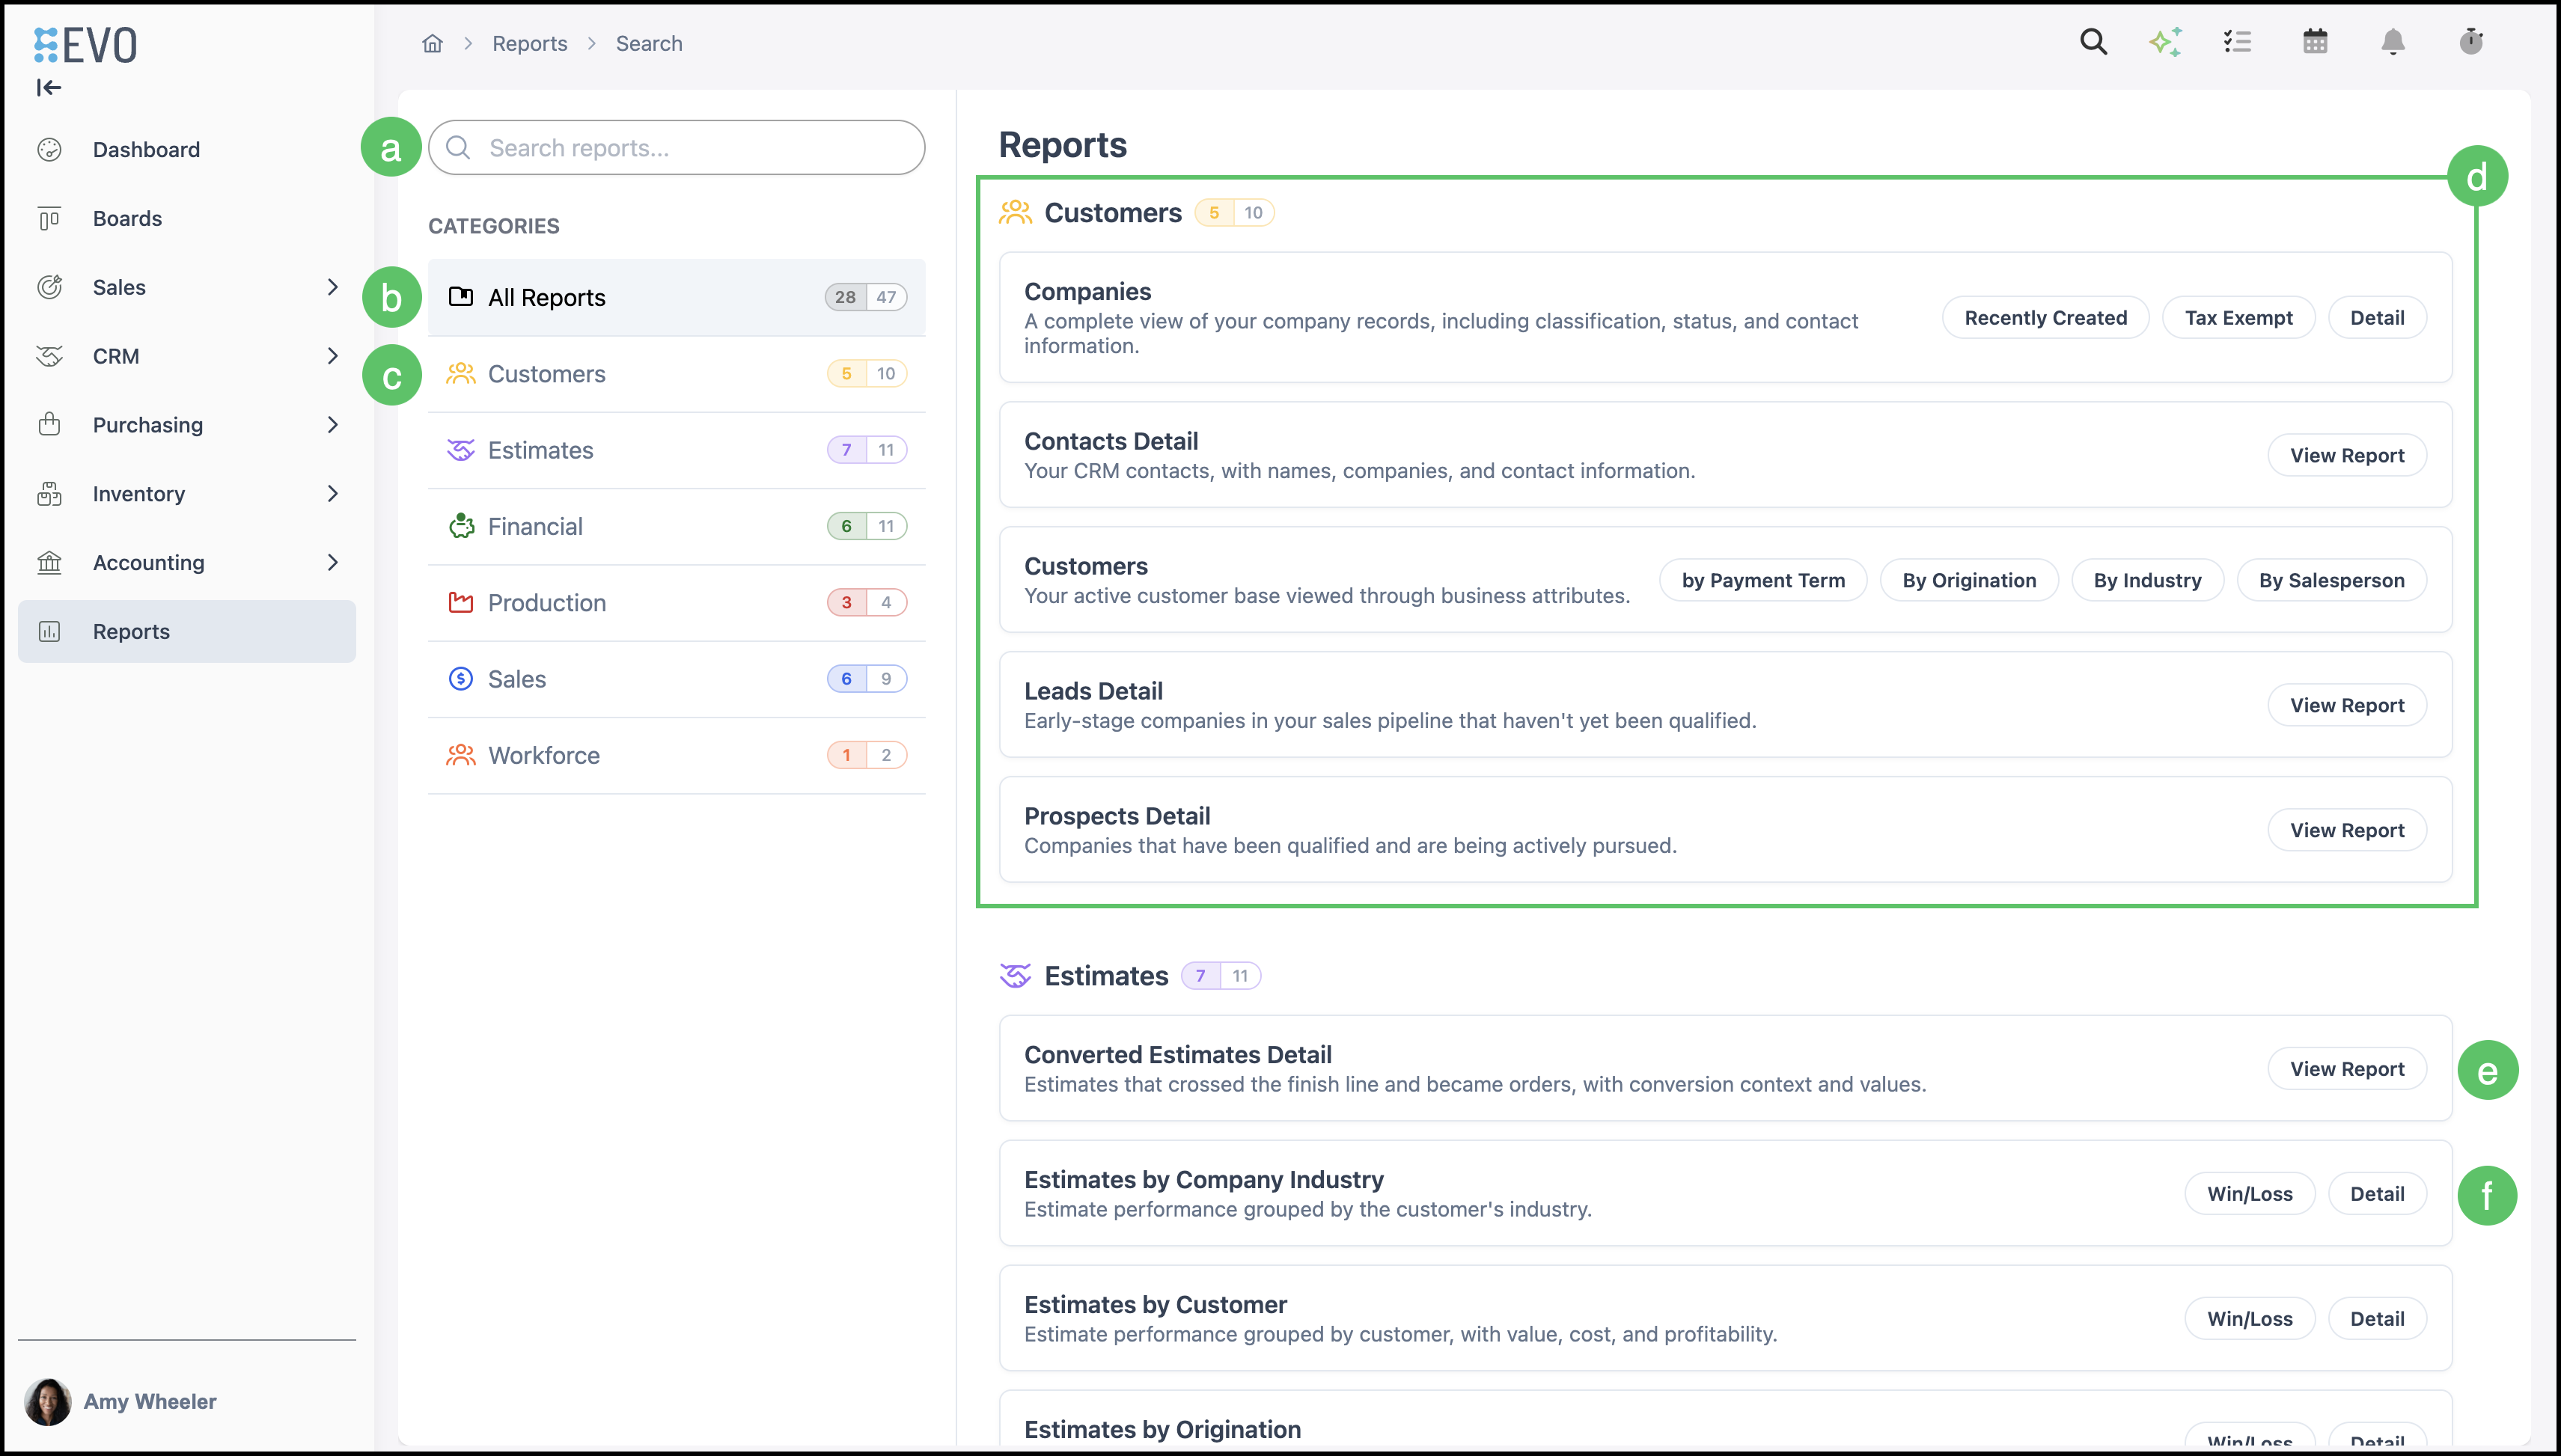
a. Search filters the list by report name, description, and related discoverable text.
Note: Clearing search restores the full list (within the selected category, if any).
b. All Reports shows the full catalog with a total count.
c. Each Category (for example Customers) shows how many reports belong to it.
Note: Selecting a Category narrows the main list to that Category only.
d. Reports appear under Category headings with consistent icons and colors.
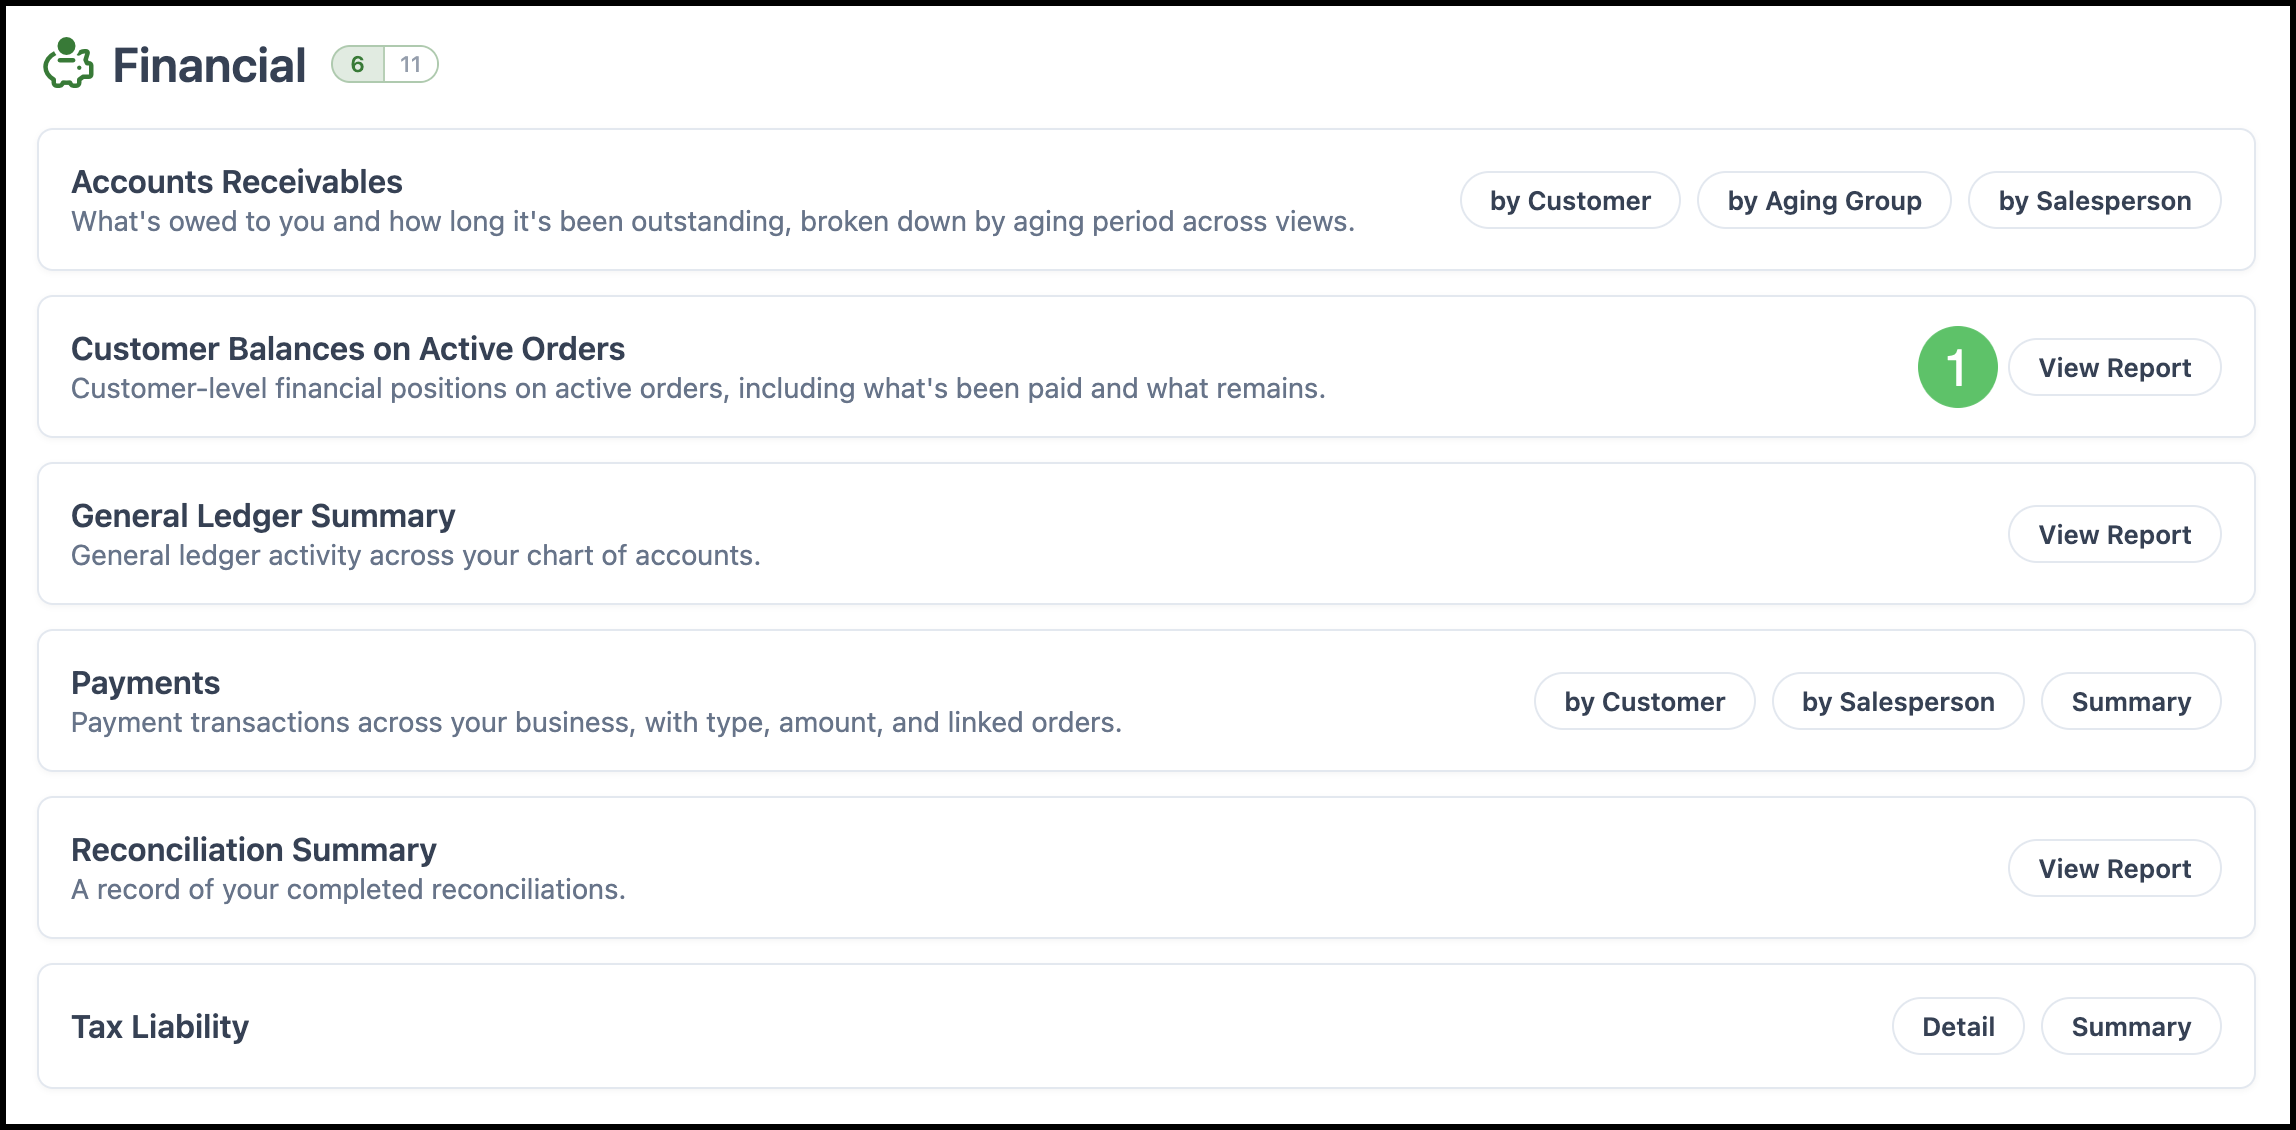
e. Single reports appear as rows with View Report.
f. Groups bundle related reports. When several variants exist in one group, the interface may show one card with multiple actions (for example different cuts of the same topic).
Opening a Report
1. Click View Report, or if multiple variants are available, click the one you wish to view (for example, 'by Customer')."
Example:
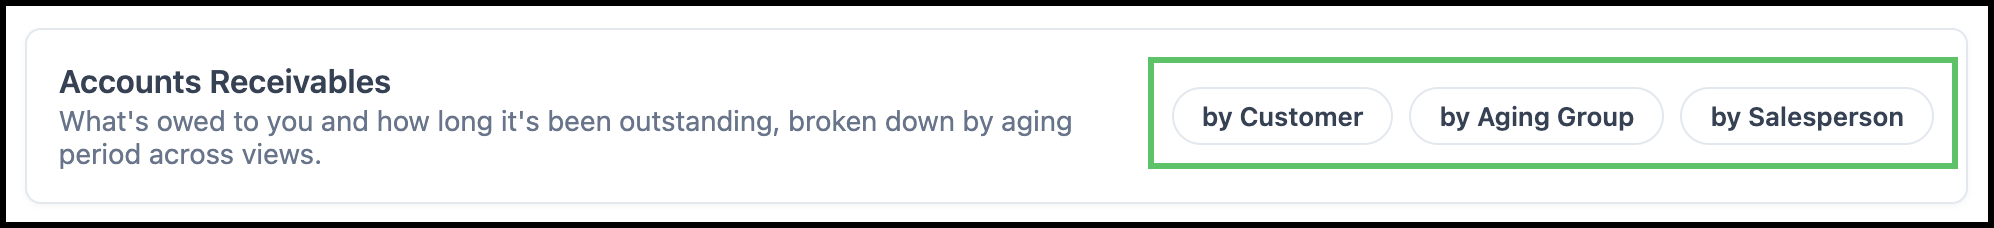
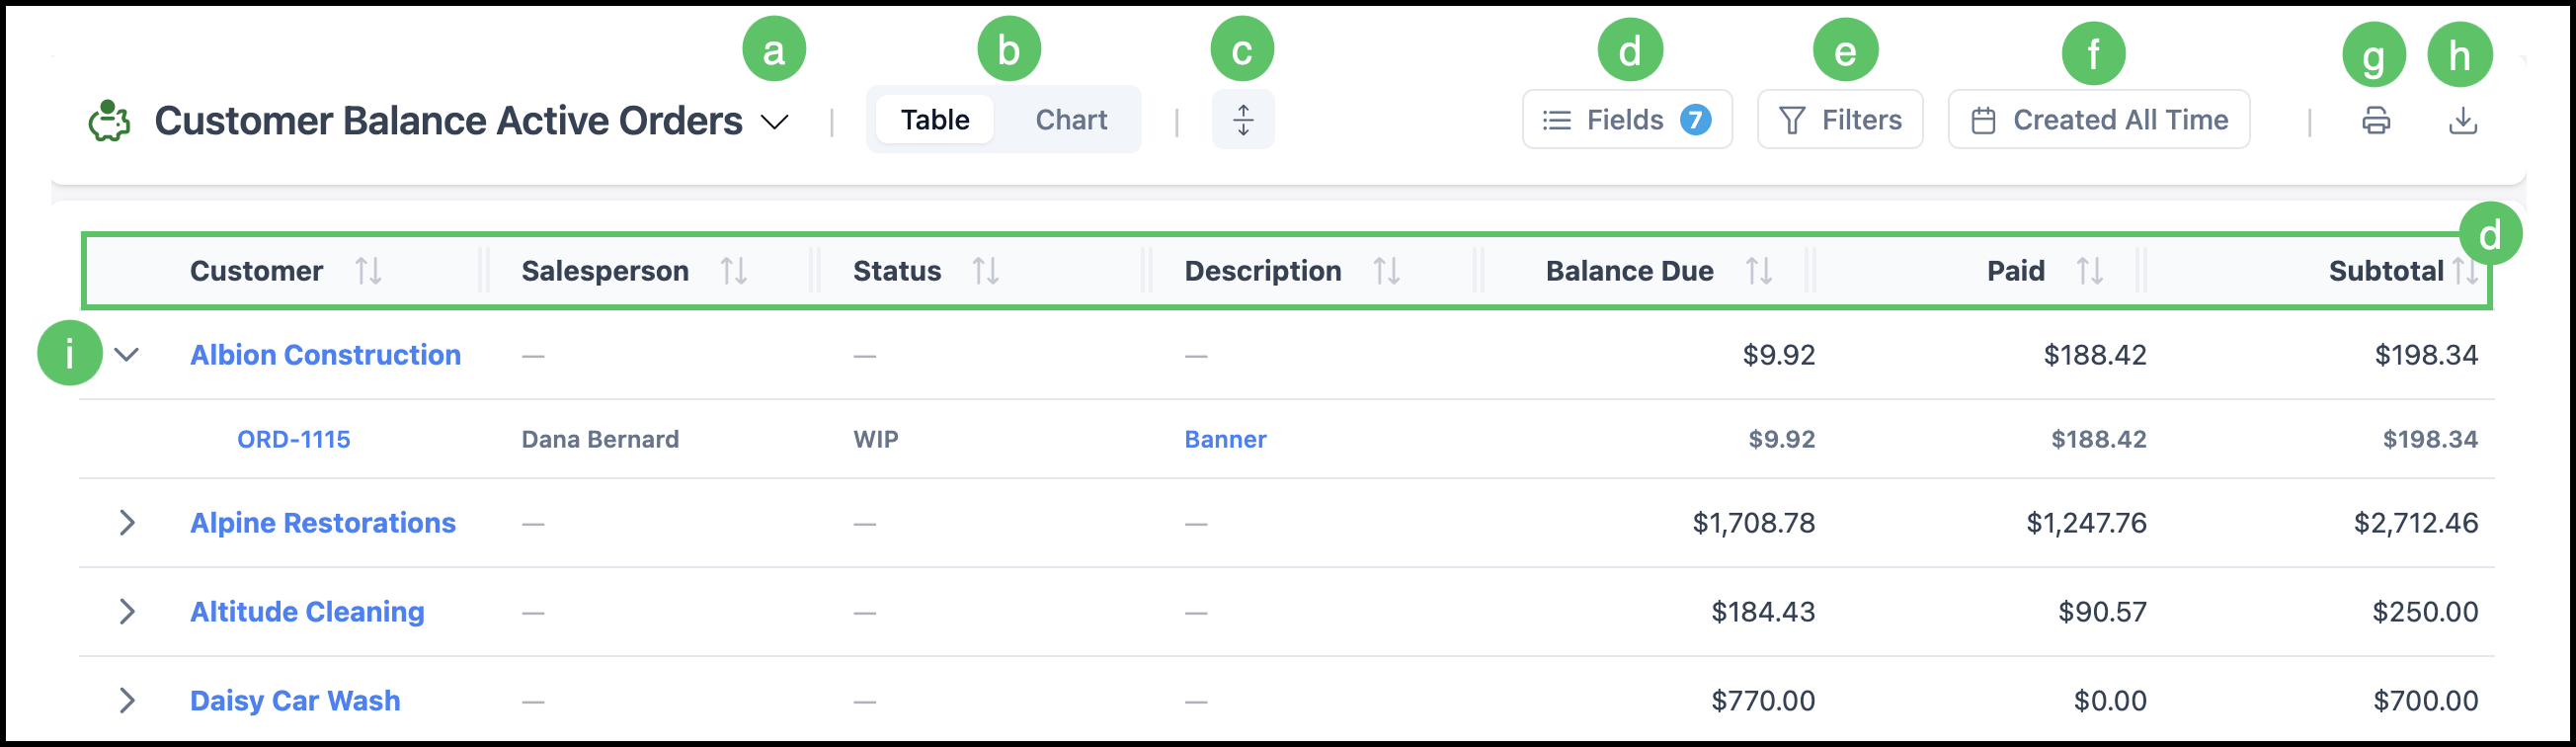
Table View
- Tables provide detailed, row-level information that supports the data shown in the Widgets.
- Tables include sorting options and the ability to add additional columns.
- Tables serve as the informational foundation of the report, giving you the data behind the analytics.
- Blue text in the row indicates a hyperlink that will open a new tab with that information.
a. The Report title includes a dropdown with a detailed description of this report.
b. The dual Table/Chart icon allows you to toggle between the two views.
c. Expand All opens up each row with more detail.
d. Fields correspond with the rows displayed on the table. More information on Fields is provided below.
e. Filters allow you to customize the data that appears in the report. More information on Filters is provided below.
f. Date allows you to select the Date Type and Date Range for this report. More information on Date is provided below.
g. Print icon. More information is provided below.
h. Download icon. More information is provided below.
i. Each row can be expanded to show more information.
Fields
- Fields are available in Table view and show up as the columns displayed.
- Each column can be sorted by clicking the column header to change the display order.
Note: When multiple columns are present, only one controls how items are sorted. The column currently driving the display is identified by a distinct Sort icon, which appears differently from the arrows in the other columns.
Customizing Fields
1. Click on the Fields icon.

2. Make the desired adjustments.
a. A lock icon indicates a system Field that cannot be adjusted or turned off.
b. The move icon allows you to reorder the columns on the Table view.
c. The toggle enables or disables this Field.
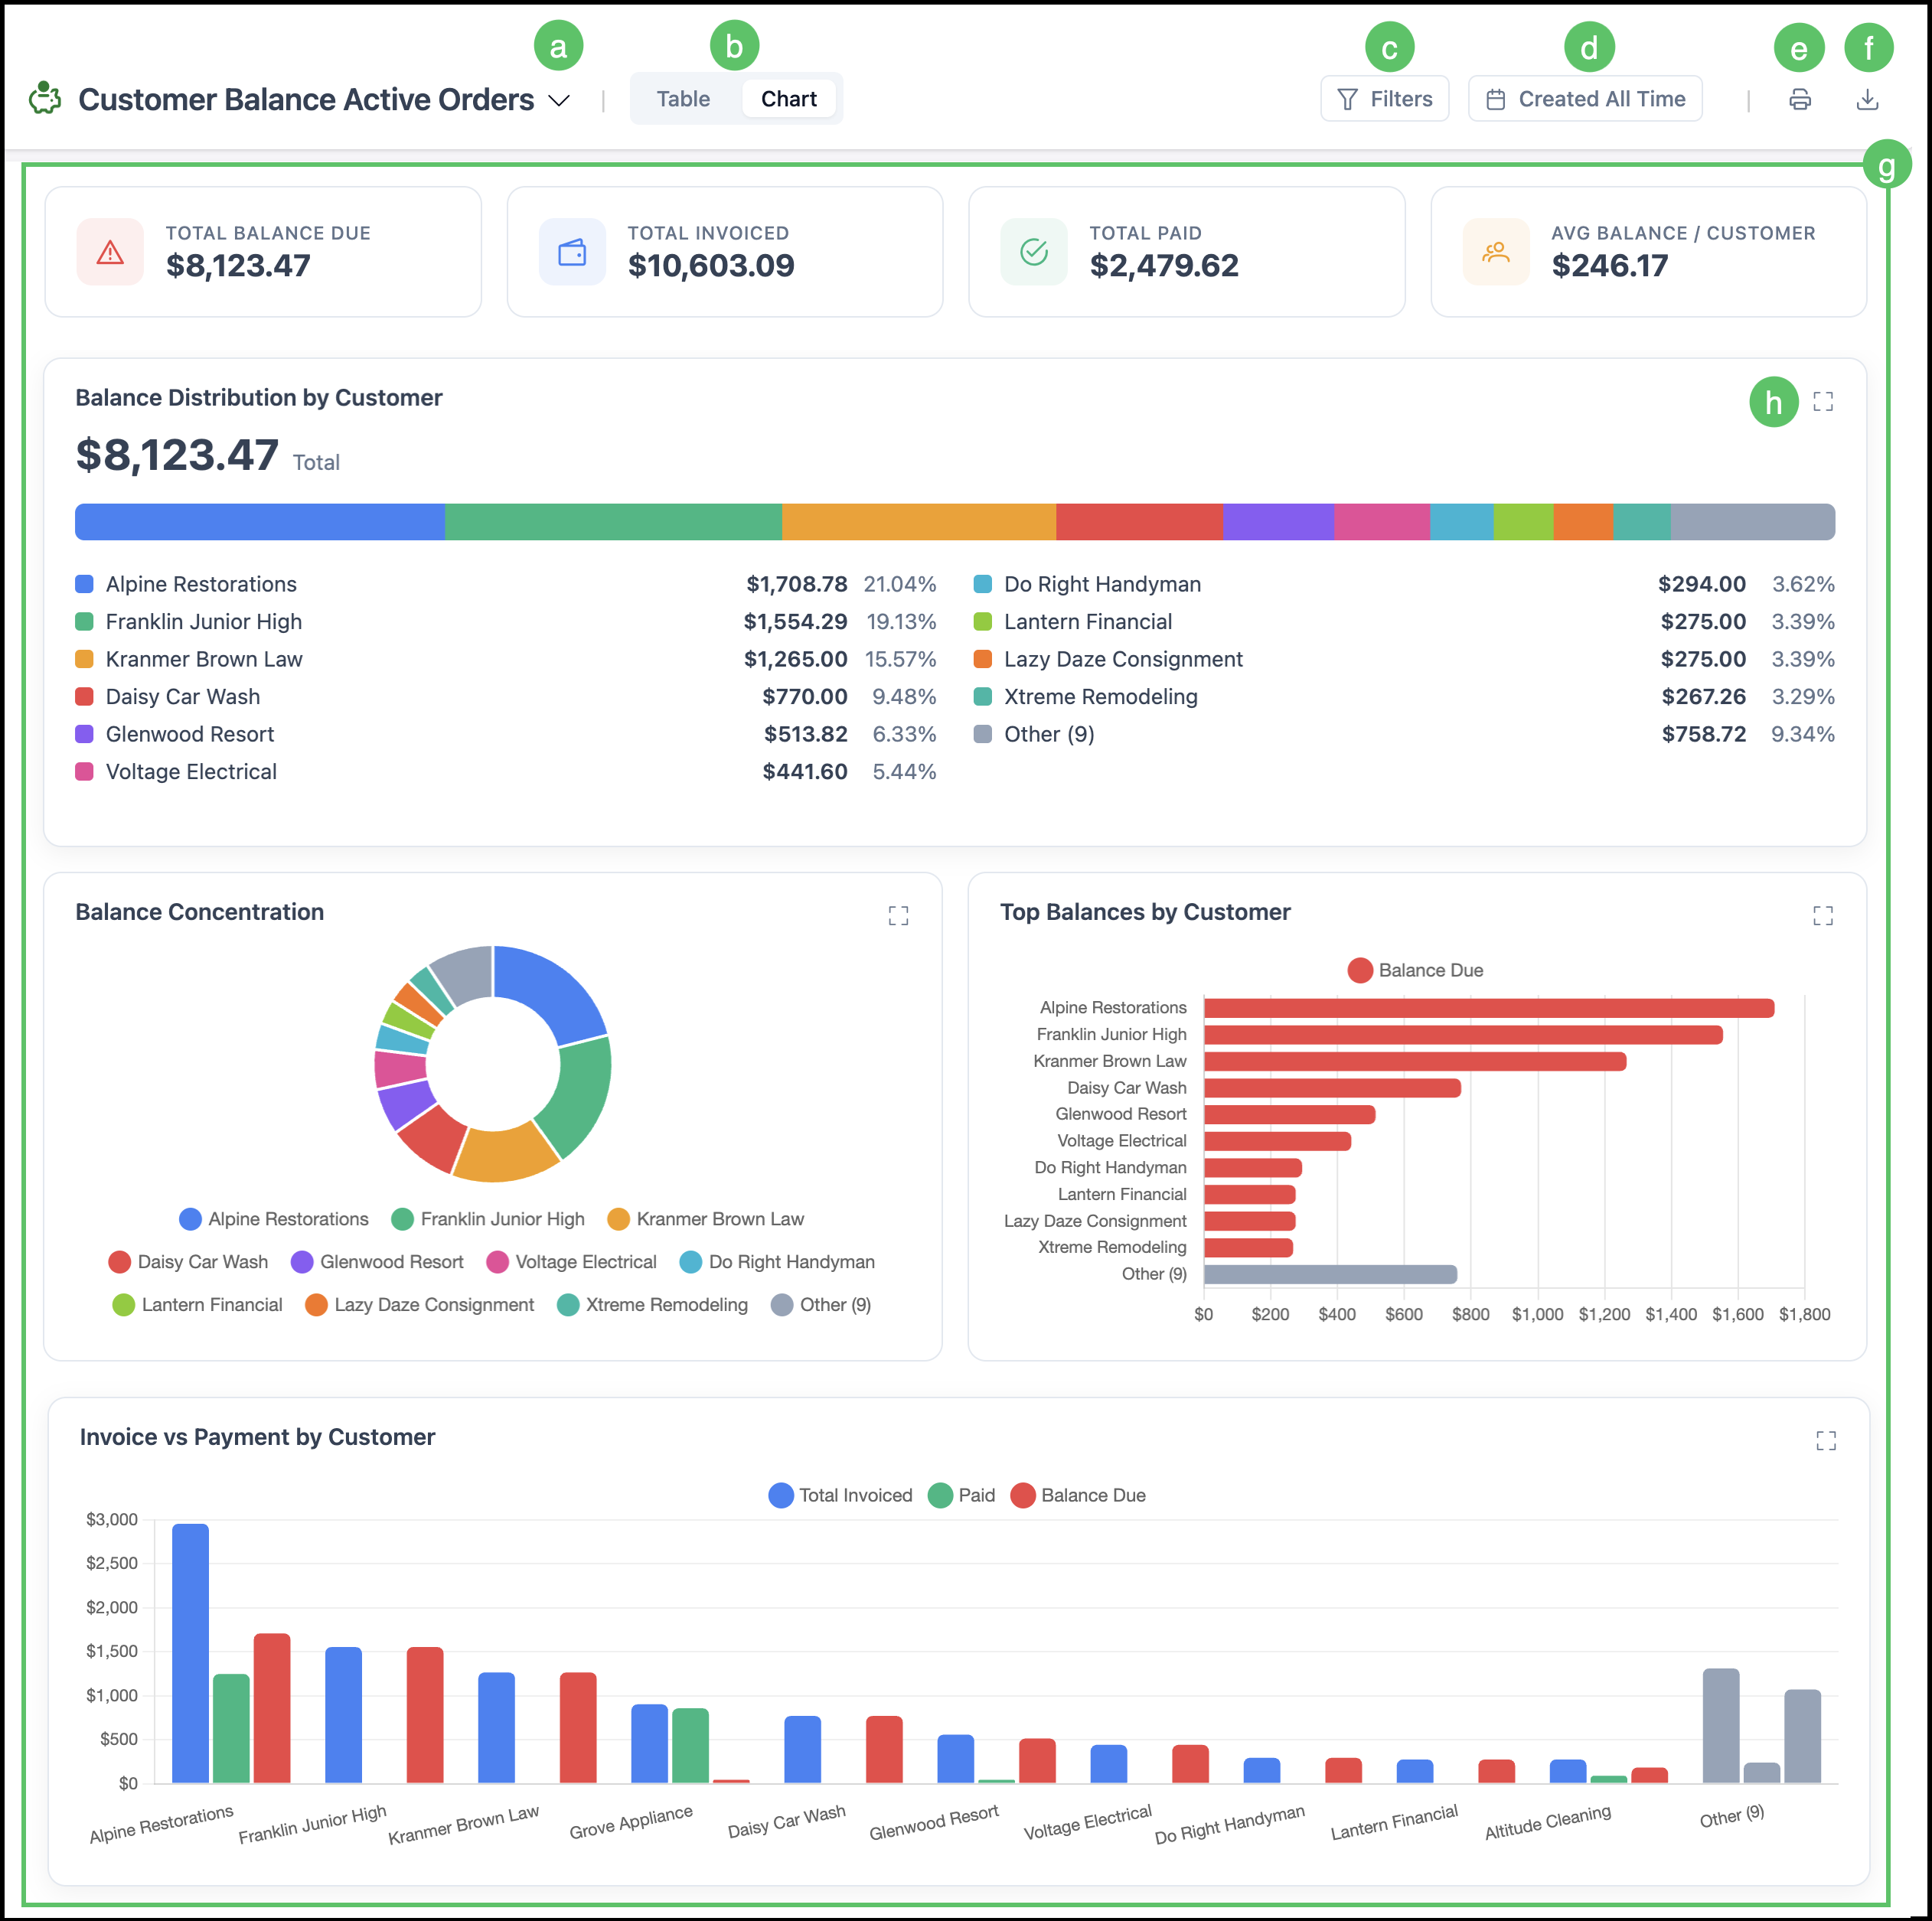
Chart View
Charts render in a grid of Widgets.
- You may expand a Widget to focus; collapsing returns to the grid.
- Filters and dates apply to chart data the same way they apply to the table.
a. The Report title includes a dropdown with a detailed description of this report.
b. The dual Table/Chart icon allows you to toggle between the two views.
c. Filters allow you to customize the data that appears in the report. More information on Filters is provided below.
d. Date allows you to select the Date Type and Date Range for this report. More information on Date is provided below.
e. Print icon. More information is provided below.
f. Download icon. More information is provided below.
g. The Widgets displayed will be unique to the report selected.
h. Expand the Widget to focus.
Widgets
- Each cell is its own Widget and displays the most up to date information available.
- Each Report will show unique Widgets specific to that Report.
Note: Widget data is refreshed regularly. If recent changes aren't visible, refresh the page or check back shortly.
a. The expand icon allows you to open up the Widget.

Filters
- Filters control which data appears in a report.
- Filters are available in both the Table and Chart view.
- Filters can be added, edited, and removed. Locked Filters (indicated by a lock icon) were defined when the report was built and cannot be changed.
Adding a Filter
1. Click the Filter icon.

2. Click the Plus icon.
3. Use the dropdown to select a Field.
4. Use the dropdown to select a Condition.
5. Use the dropdown to select a Value.
Note: The report will automatically update to this Filter.
a. The Minus icon will remove a Filter.
b. Additional Filters can be added using the Plus icon.

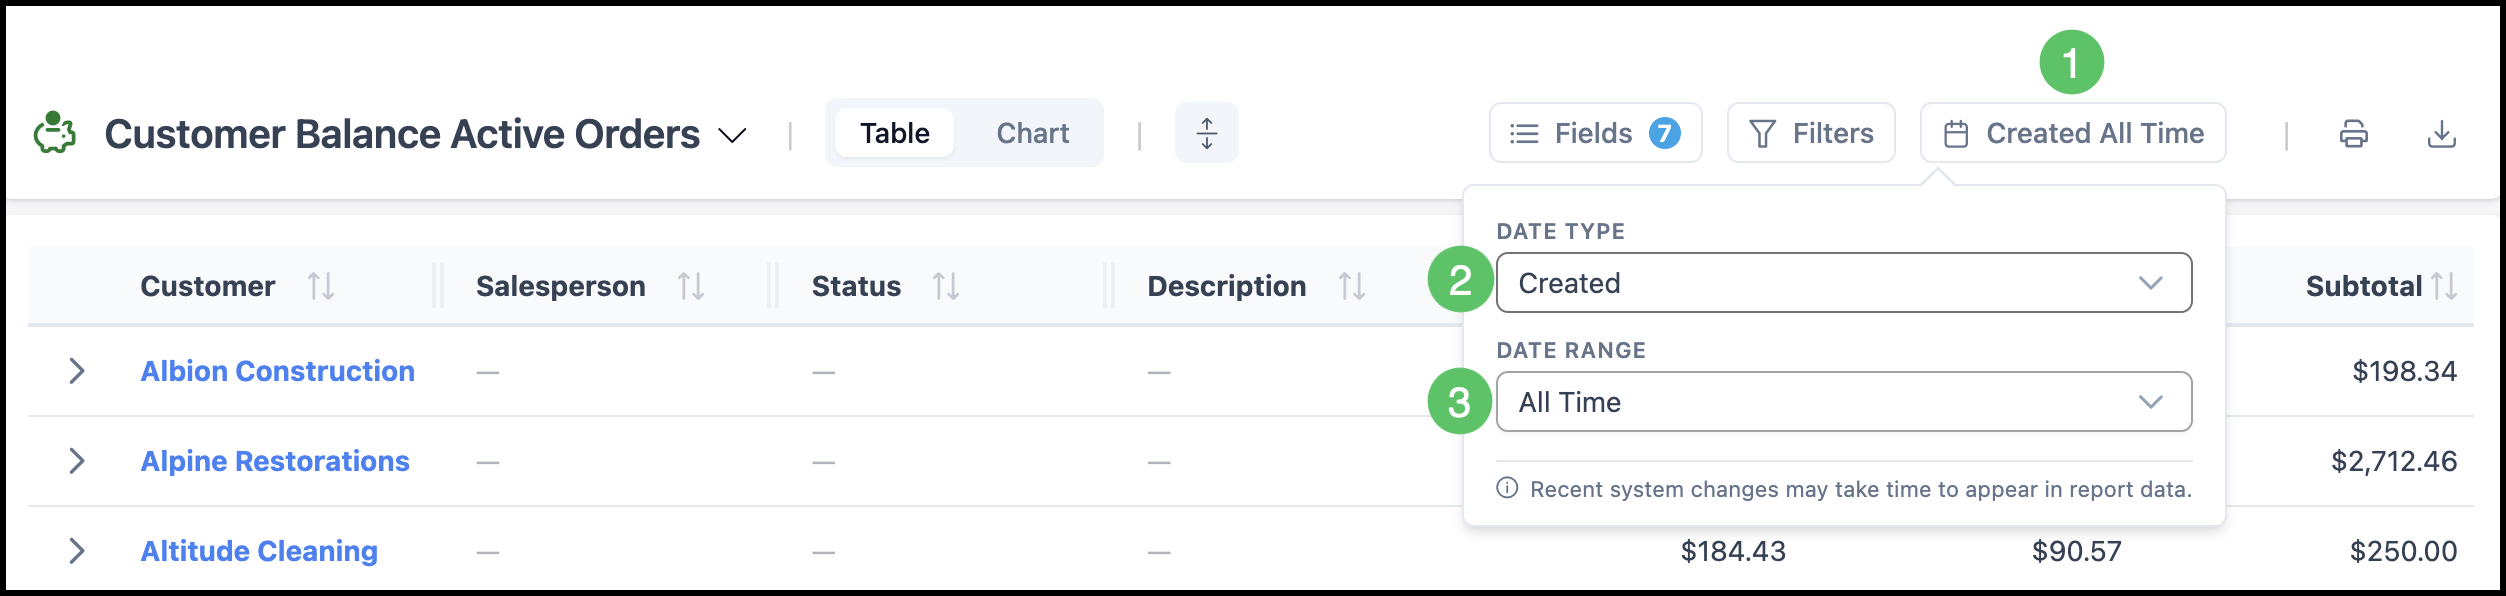
Date
- Date is available in both Table and Chart view.
- Date Type may vary based on the report selected.
- Report data will automatically update to reflect the Date Type and Date Range selected.
1. Click the Date icon.
2. Use the dropdown to select the Date Type.
Note: Options may include Created, WIP, Invoiced, etc.
3. Use the dropdown to select the Date Range.
Note: Options may include Last Week, Last Month, Last Quarter, Last Year, All Time, or Custom.
- Print is available in both Table and Chart view.
1. Click the Print icon.
Note: Opens print preview in a new tab.

2. Adjust Page Setup.
3. Click the Print icon and use the browser print dialog.

Download
- Download is available in both Table and Chart views.
- Data will be exported to a CSV file.
- Export reflects visible columns, current sort, current filters, and nested layout when the report is hierarchical.
1. Click the Download icon to export the data to CSV.
