
The Sales Dashboard and Business Monitor provide different ways to view business performance in CoreBridge. The Dashboard offers a customizable collection of widgets for tracking the information most relevant to your business, while the Business Monitor provides a period-based view of financial activity and open work. This article explains the differences between these tools and when to use each one.
For more information on Monitors, please see Monitors Overview.
Table of Contents
- Quick Comparison
- Purpose of the Sales Dashboard
- Purpose of the Business Monitor
- Comparing Dashboard and Monitor Values
- Related Articles
Quick Comparison
| Sales Dashboard | A customizable layout of widgets or tiles you add with by clicking on an empty space. Each widget focuses on one slice of the business (goals, payments, estimates, status counts, and similar). |
| Business Monitor Financial tab | A built-in monitor providing a financial overview: a full-size live chart for the selected period. |
| Business Monitor Sales tab | The other built-in monitor tab, focused on Estimate and Order activity for the period. |
Purpose of the Sales Dashboard
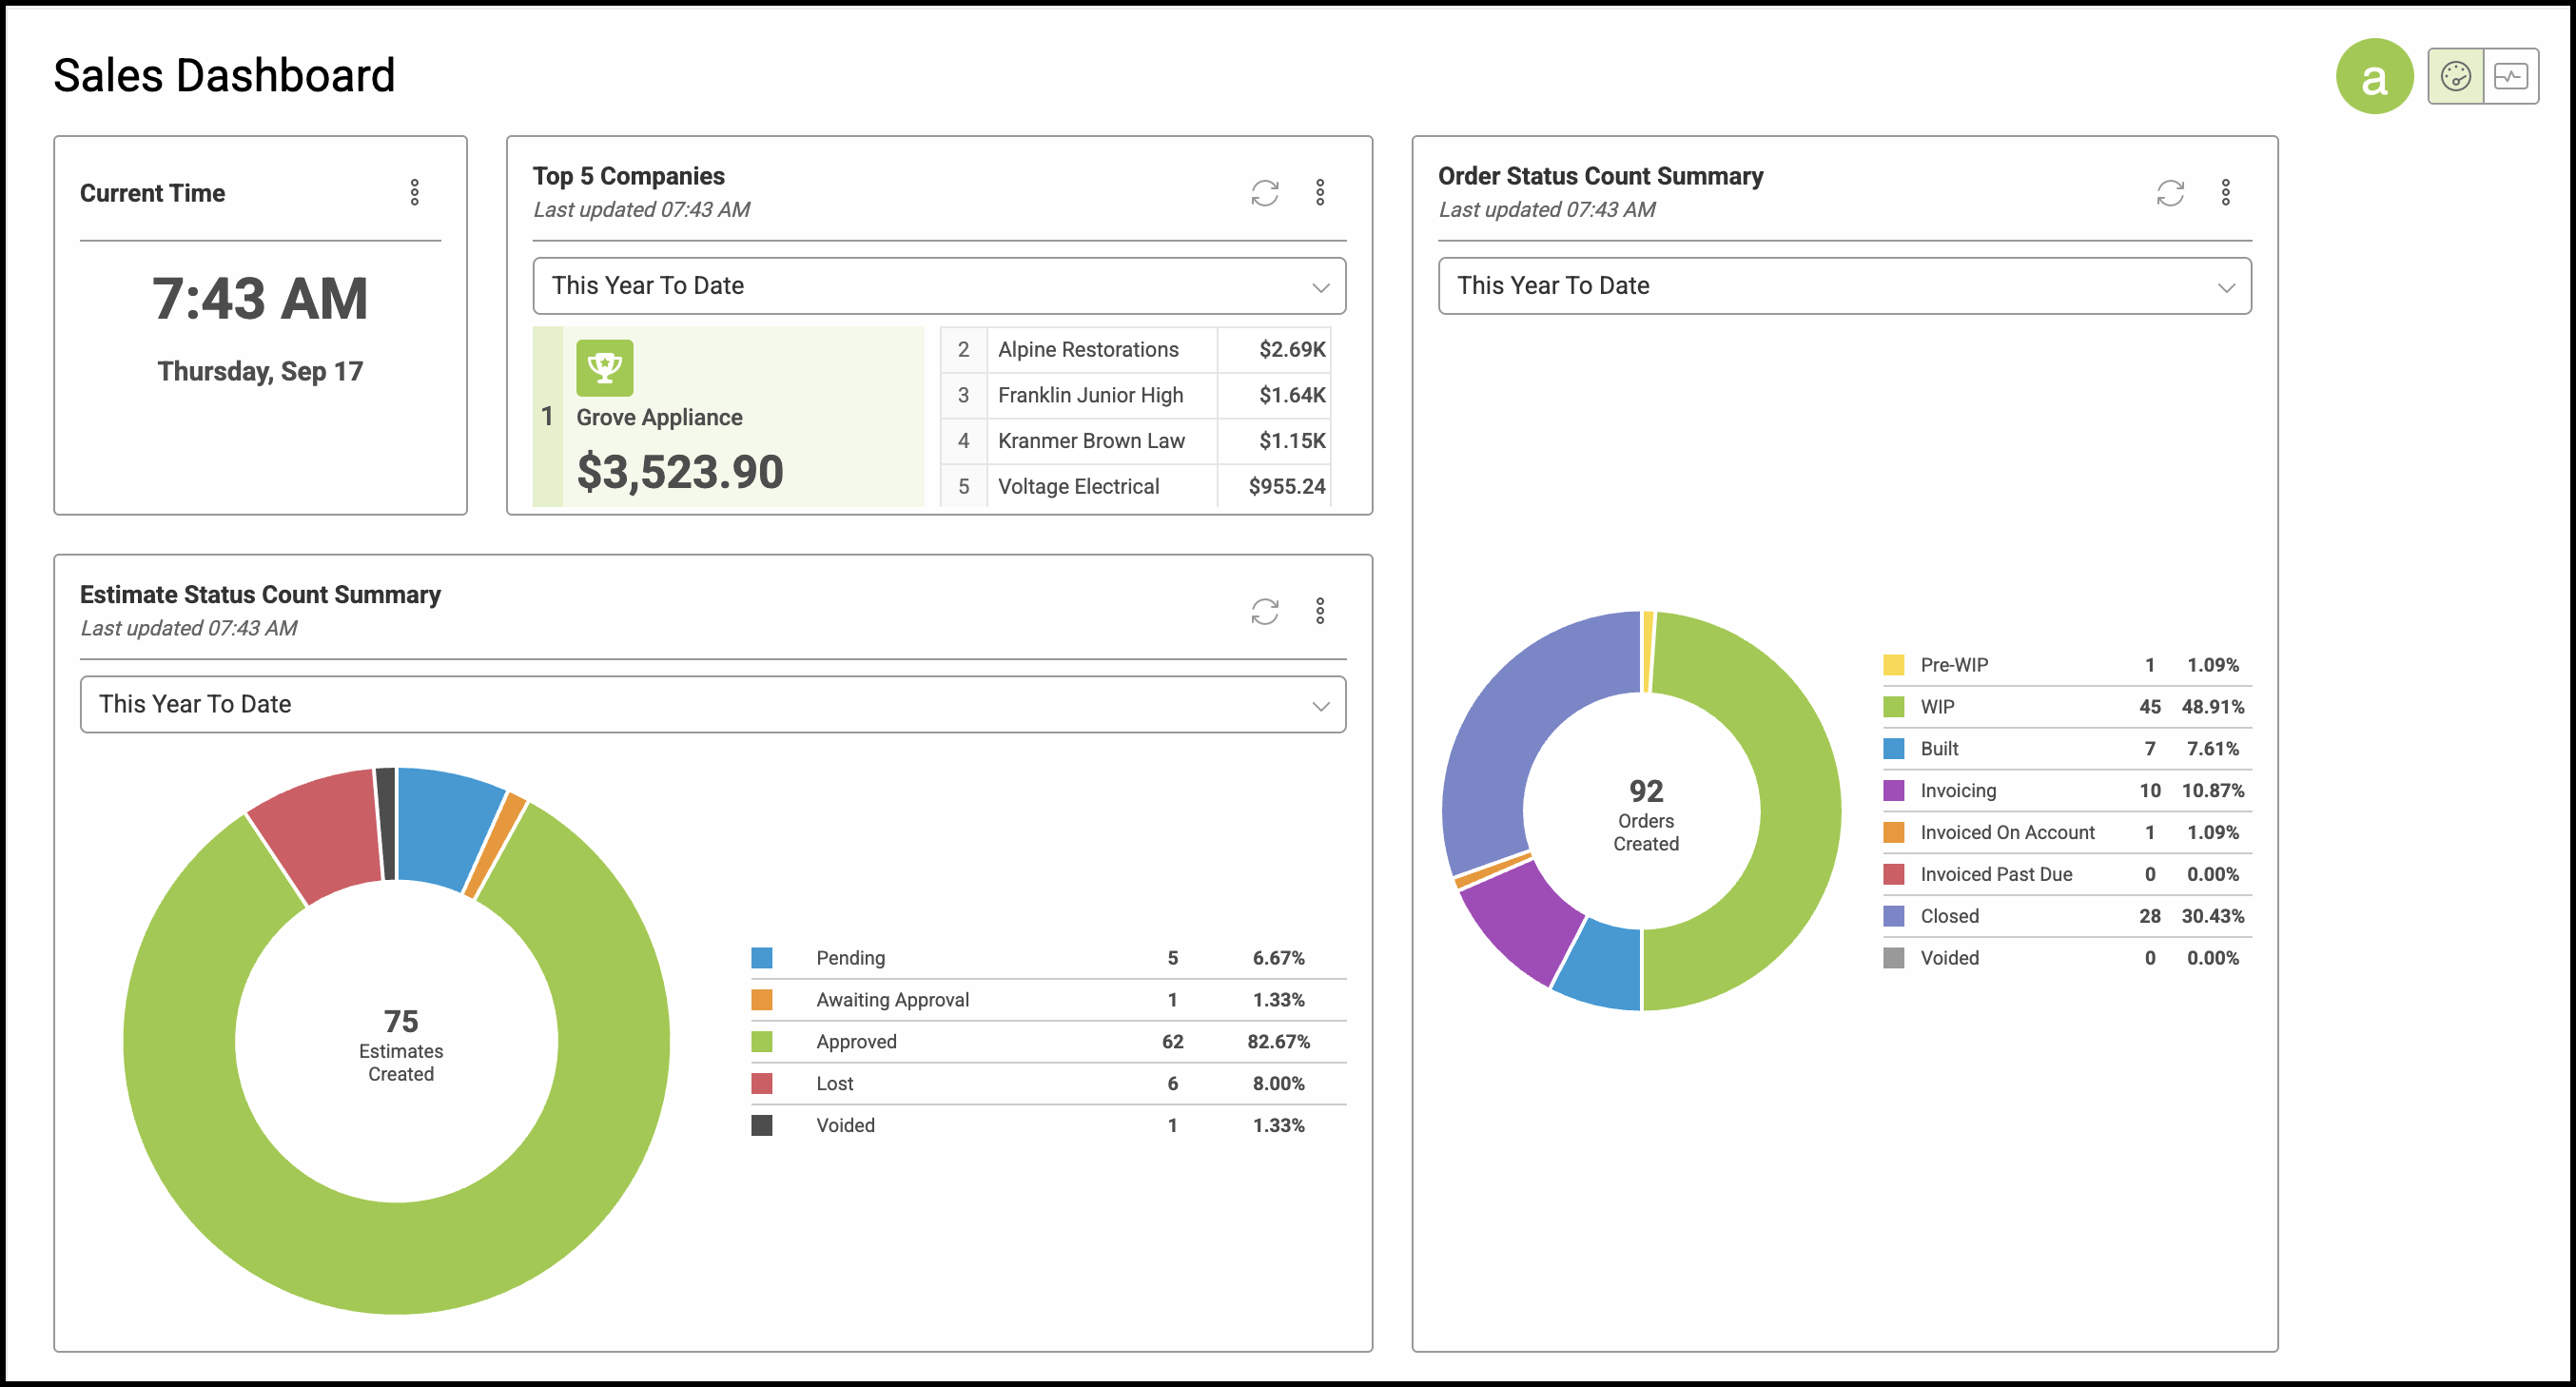
Use the Sales Dashboard tab when you want a personalized mix of tiles. Common examples include Business Goals, Monthly Sales Goal Progress, Payment Summary, Salesperson New Estimate Totals, and status summaries. Each widget has its own filters and refresh settings. You can add, remove, and rearrange widgets to match how you work.
For setup steps, see How to Set Up Dashboards and Widgets and Widgets Overview.
Sales Dashboard is found by navigating to Sales / Dashboard.
a. Paired icons in the top right of the screen toggle between Sales Dashboard and Business Monitor.
Purpose of the Business Monitor
The Business Monitor provides a visual summary of financial and sales activity across two tabs: Financials and Sales. Each tab presents different business data to help track current activity, progress, and performance.
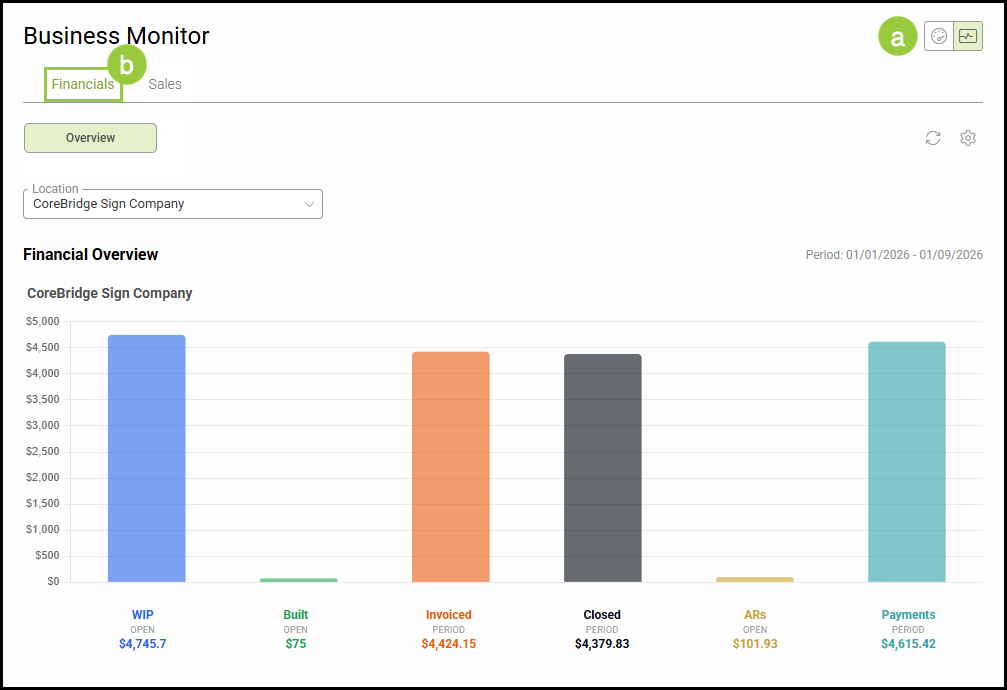
a. Financials – Provides a financial overview of open work and activity within the selected date range. This can include the value of open Pre-WIP, WIP, Built, and Invoicing Orders, along with Invoiced and Closed Orders, Accounts Receivable, Payments, and Sales Goals.
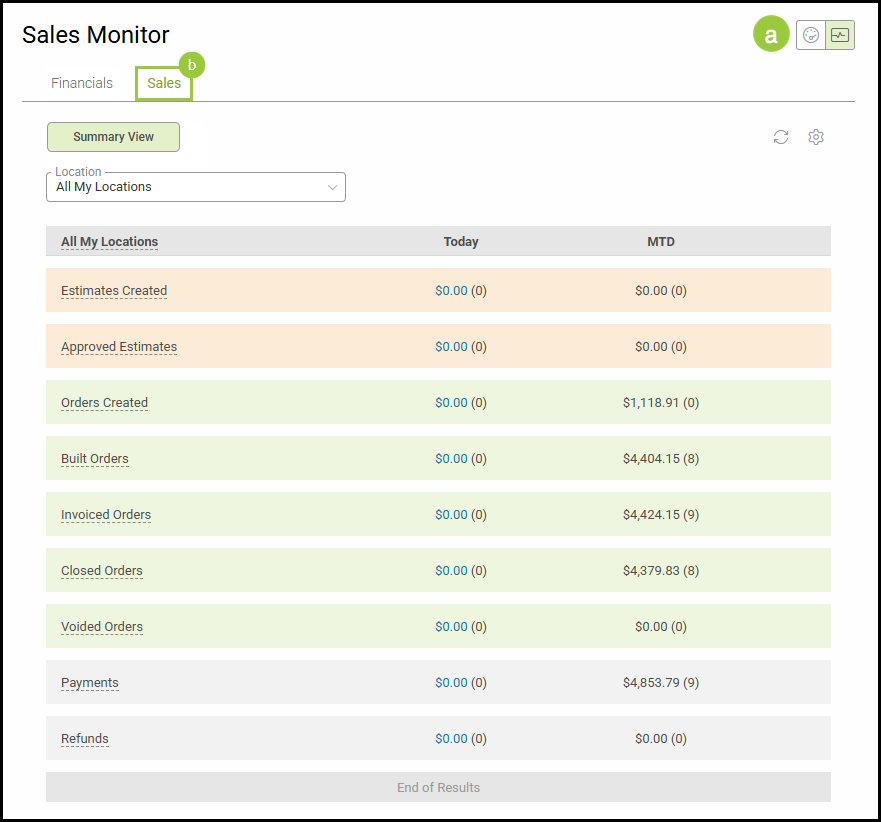
b. Sales – Provides a summary of Estimate and Order activity by Status, along with Payments and Refunds. Estimate activity is displayed in orange, Order activity in green, and Payments and Refunds in gray. Values are shown for both the current day and month to date.
Note: The information displayed on each tab can be shown or hidden through Monitor Settings. See Overview of the Monitor Screen below for more information about these settings.
Business Monitor is located by navigating to Sales / Dashboard and selecting the Business Monitor icon.
a. Paired icons in the top right of the screen toggle between Sales Dashboard and Business Monitor.
b. Financials tab shows a financial overview.
a. Paired icons in the top right of the screen toggle between Sales Dashboard and Business Monitor.
b. Sales tab shows Estimate and Order activity.
Comparing Dashboard and Monitor Values
Dashboard widgets and the Financial Monitor may display related business information, but the values are not always calculated or presented in the same way.
Business Goals tracks progress toward established goals, while the Financial Monitor displays financial activity based on its OPEN and PERIOD categories. Values may differ depending on the date range and how each metric is calculated.
Payment Summary provides payment information based on the widget's settings and date range. Financial Monitor Payments (PERIOD) reflects payment activity within the date range selected for the monitor.
Monthly Sales Goal Progress breaks the current month's goal into categories such as Completed, In Progress, Remaining, and optional Potential. This provides a goal-progress view rather than the financial pipeline view shown in the Financial Monitor.
When comparing values, first confirm that the same date range is being used. Then consider whether the value comes from a Dashboard widget or an OPEN or PERIOD metric on the Financial Monitor.
Related Articles
How to Set Up Dashboards and Widgets